| Red | Green | Blue | |
| z | 17.64 | ||
| znorm | Inf | ||
| sky | -NaN | -NaN | -Inf |
| S/N | 32.3 | 55.9 | 60.1 |
| S/N(c) | 0.0 | 0.0 | 0.0 |
| SN(E/C) |
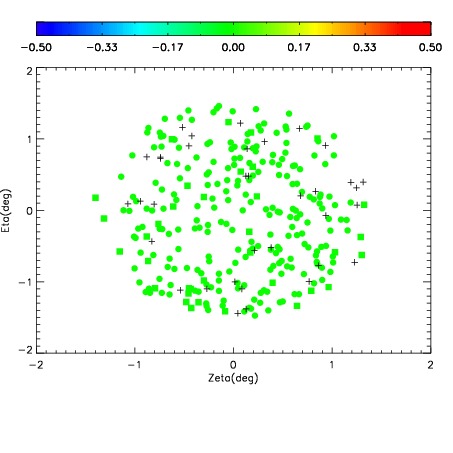
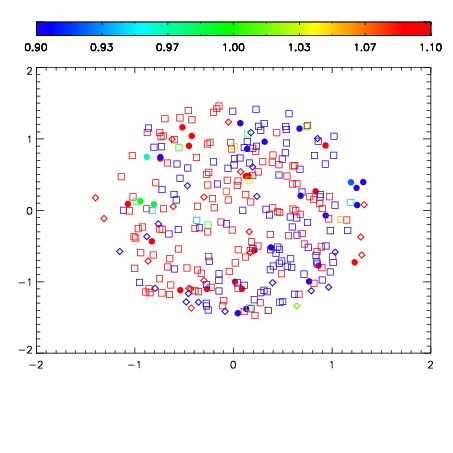
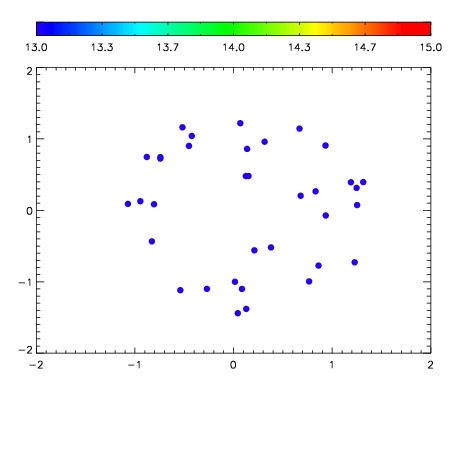

| Frame | Nreads | Zeropoints | Mag plots | Spatial mag deviation | Spatial sky 16325A emission deviations (filled: sky, open: star) | Spatial sky continuum emission | Spatial sky telluric CO2 absorption deviations (filled: H < 10) | |||||||||||||||||||||||
| 0 | 0 |
|
|
|
|
|
|
| IPAIR | NAME | SHIFT | NEWSHIFT | S/N | NAME | SHIFT | NEWSHIFT | S/N |
| 0 | 10260082 | 0.492951 | 0.00000 | 215.162 | 10260083 | 0.00179881 | 0.491152 | 222.272 |
| 1 | 10260085 | 0.491892 | 0.00105900 | 214.914 | 10260084 | 0.00157799 | 0.491373 | 214.818 |
| 2 | 10260081 | 0.492533 | 0.000418007 | 210.668 | 10260088 | -7.04422e-05 | 0.493021 | 208.067 |
| 3 | 10260089 | 0.492467 | 0.000484020 | 207.376 | 10260080 | 0.00000 | 0.492951 | 199.533 |
| 4 | 10260086 | 0.492314 | 0.000636995 | 192.812 | 10260087 | -0.000255732 | 0.493207 | 199.430 |