| Red | Green | Blue | |
| z | 17.64 | ||
| znorm | Inf | ||
| sky | -Inf | -Inf | -Inf |
| S/N | 25.3 | 44.3 | 48.2 |
| S/N(c) | 0.0 | 0.0 | 0.0 |
| SN(E/C) |
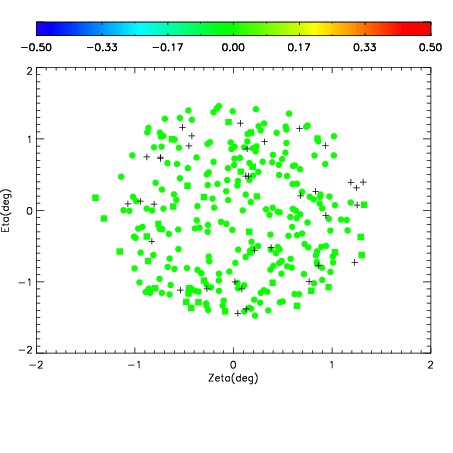
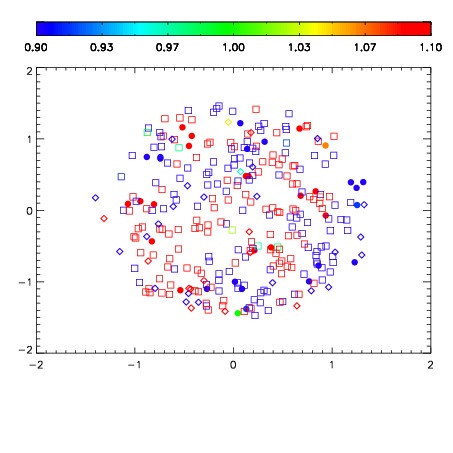
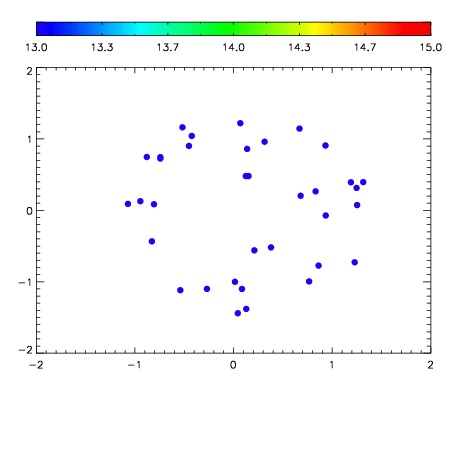

| Frame | Nreads | Zeropoints | Mag plots | Spatial mag deviation | Spatial sky 16325A emission deviations (filled: sky, open: star) | Spatial sky continuum emission | Spatial sky telluric CO2 absorption deviations (filled: H < 10) | |||||||||||||||||||||||
| 0 | 0 |
|
|
|
|
|
|
| IPAIR | NAME | SHIFT | NEWSHIFT | S/N | NAME | SHIFT | NEWSHIFT | S/N |
| 0 | 10540076 | 0.499747 | 0.00000 | 167.075 | 10540077 | 0.00214445 | 0.497603 | 131.160 |
| 1 | 10540072 | 0.498078 | 0.00166902 | 214.780 | 10540074 | 0.00148139 | 0.498266 | 208.352 |
| 2 | 10540071 | 0.497262 | 0.00248501 | 210.996 | 10540070 | 0.00000 | 0.499747 | 206.518 |
| 3 | 10540075 | 0.498919 | 0.000827998 | 201.780 | 10540073 | 0.00104008 | 0.498707 | 205.165 |