| Red | Green | Blue | |
| z | 17.64 | ||
| znorm | Inf | ||
| sky | -Inf | -Inf | -Inf |
| S/N | 24.9 | 44.8 | 49.9 |
| S/N(c) | 0.0 | 0.0 | 0.0 |
| SN(E/C) |

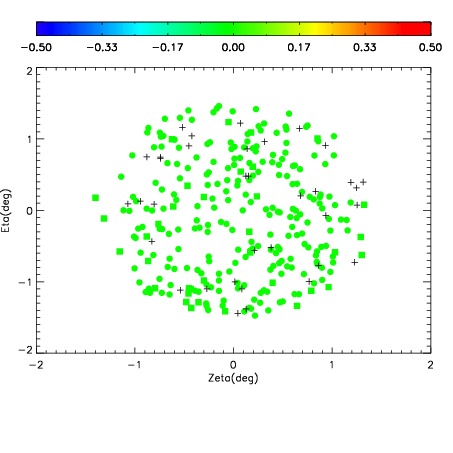
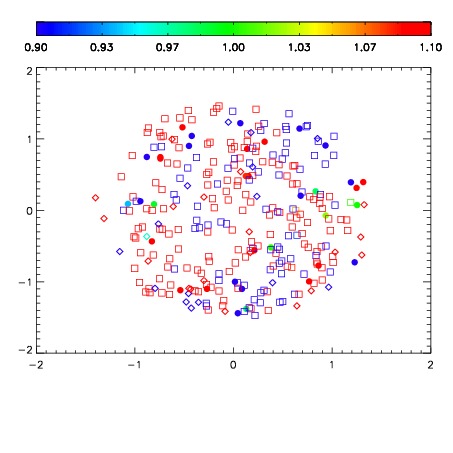
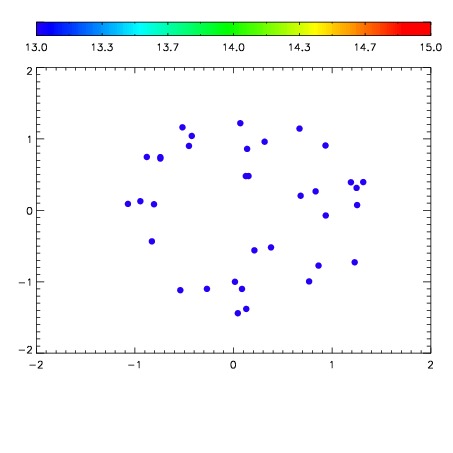

| Frame | Nreads | Zeropoints | Mag plots | Spatial mag deviation | Spatial sky 16325A emission deviations (filled: sky, open: star) | Spatial sky continuum emission | Spatial sky telluric CO2 absorption deviations (filled: H < 10) | |||||||||||||||||||||||
| 0 | 0 |
|
|
|
|
|
|
| IPAIR | NAME | SHIFT | NEWSHIFT | S/N | NAME | SHIFT | NEWSHIFT | S/N |
| 0 | 10750049 | 0.491055 | 0.00000 | 202.356 | 10750048 | 0.00000 | 0.491055 | 176.592 |
| 1 | 10750054 | 0.487282 | 0.00377300 | 213.139 | 10750055 | -0.00319581 | 0.494251 | 208.750 |
| 2 | 10750053 | 0.487430 | 0.00362501 | 212.792 | 10750051 | -0.00113316 | 0.492188 | 205.247 |
| 3 | 10750050 | 0.491002 | 5.30183e-05 | 204.389 | 10750052 | -0.00141884 | 0.492474 | 200.899 |