| Red | Green | Blue | |
| z | 17.64 | ||
| znorm | Inf | ||
| sky | -Inf | -Inf | -Inf |
| S/N | 19.0 | 36.1 | 37.0 |
| S/N(c) | 0.0 | 0.0 | 0.0 |
| SN(E/C) |
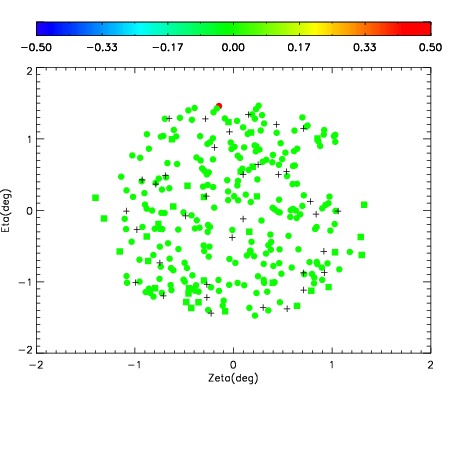
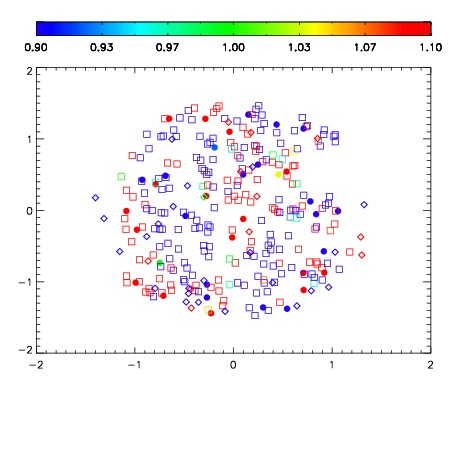


| Frame | Nreads | Zeropoints | Mag plots | Spatial mag deviation | Spatial sky 16325A emission deviations (filled: sky, open: star) | Spatial sky continuum emission | Spatial sky telluric CO2 absorption deviations (filled: H < 10) | |||||||||||||||||||||||
| 0 | 0 |
|
|
|
|
|
|
| IPAIR | NAME | SHIFT | NEWSHIFT | S/N | NAME | SHIFT | NEWSHIFT | S/N |
| 0 | 10610029 | 0.506020 | 0.00000 | 144.467 | 10610035 | 0.00336103 | 0.502659 | 147.631 |
| 1 | 10610034 | 0.505928 | 9.20296e-05 | 149.671 | 10610032 | 0.00154540 | 0.504475 | 147.773 |
| 2 | 10610033 | 0.504904 | 0.00111604 | 142.484 | 10610031 | 0.00122036 | 0.504800 | 145.844 |
| 3 | 10610030 | 0.505653 | 0.000366986 | 138.504 | 10610028 | 0.00000 | 0.506020 | 139.694 |