| Red | Green | Blue | |
| z | 17.64 | ||
| znorm | Inf | ||
| sky | -Inf | -Inf | -Inf |
| S/N | 24.7 | 45.0 | 48.1 |
| S/N(c) | 0.0 | 0.0 | 0.0 |
| SN(E/C) |
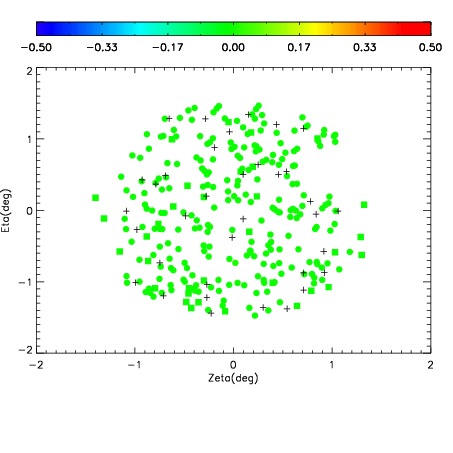
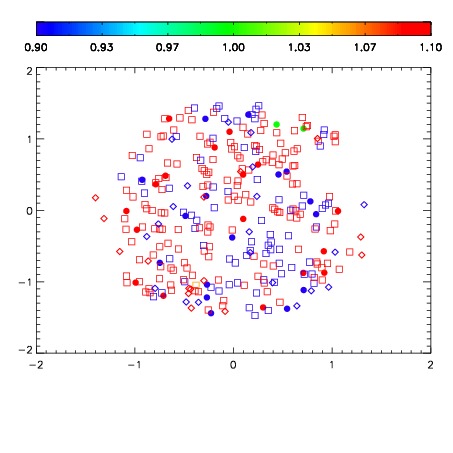
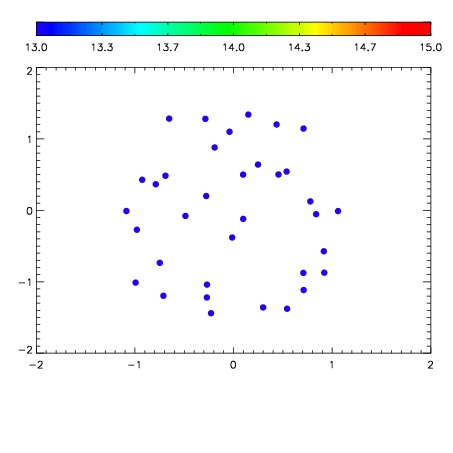

| Frame | Nreads | Zeropoints | Mag plots | Spatial mag deviation | Spatial sky 16325A emission deviations (filled: sky, open: star) | Spatial sky continuum emission | Spatial sky telluric CO2 absorption deviations (filled: H < 10) | |||||||||||||||||||||||
| 0 | 0 |
|
|
|
|
|
|
| IPAIR | NAME | SHIFT | NEWSHIFT | S/N | NAME | SHIFT | NEWSHIFT | S/N |
| 0 | 10790053 | 0.497398 | 0.00000 | 198.053 | 10790054 | 0.000612131 | 0.496786 | 201.017 |
| 1 | 10790052 | 0.497064 | 0.000333995 | 201.029 | 10790051 | -0.000845764 | 0.498244 | 204.317 |
| 2 | 10790048 | 0.496177 | 0.00122100 | 197.633 | 10790050 | -0.00132399 | 0.498722 | 199.456 |
| 3 | 10790049 | 0.496482 | 0.000915974 | 191.744 | 10790047 | 0.00000 | 0.497398 | 194.847 |