| Red | Green | Blue | |
| z | 17.64 | ||
| znorm | Inf | ||
| sky | -Inf | -Inf | -Inf |
| S/N | 30.6 | 50.7 | 57.1 |
| S/N(c) | 0.0 | 0.0 | 0.0 |
| SN(E/C) |
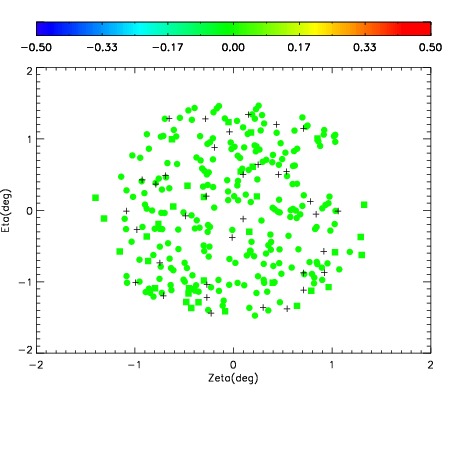
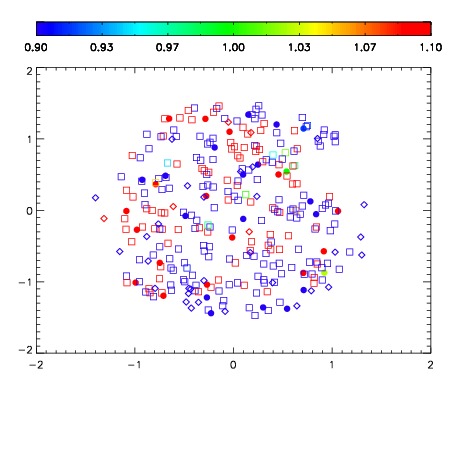
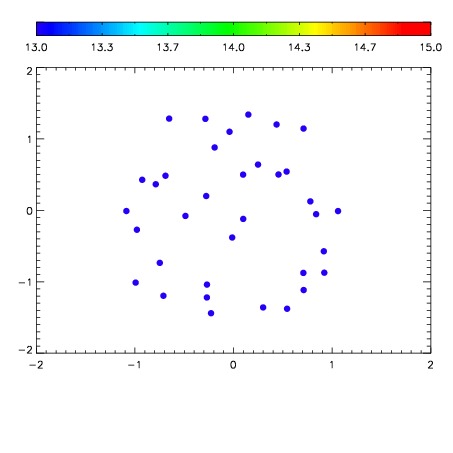

| Frame | Nreads | Zeropoints | Mag plots | Spatial mag deviation | Spatial sky 16325A emission deviations (filled: sky, open: star) | Spatial sky continuum emission | Spatial sky telluric CO2 absorption deviations (filled: H < 10) | |||||||||||||||||||||||
| 0 | 0 |
|
|
|
|
|
|
| IPAIR | NAME | SHIFT | NEWSHIFT | S/N | NAME | SHIFT | NEWSHIFT | S/N |
| 0 | 10890050 | 0.508292 | 0.00000 | 214.853 | 10890052 | -0.00389684 | 0.512189 | 211.769 |
| 1 | 10890049 | 0.508042 | 0.000250041 | 217.169 | 10890051 | -0.00369828 | 0.511990 | 213.376 |
| 2 | 10890054 | 0.507425 | 0.000867009 | 212.356 | 10890048 | 0.00000 | 0.508292 | 211.416 |
| 3 | 10890053 | 0.506680 | 0.00161201 | 211.433 | 10890055 | -0.00391940 | 0.512211 | 210.794 |