| Red | Green | Blue | |
| z | 17.64 | ||
| znorm | Inf | ||
| sky | -Inf | -Inf | -Inf |
| S/N | 18.6 | 35.4 | 41.0 |
| S/N(c) | 0.0 | 0.0 | 0.0 |
| SN(E/C) |
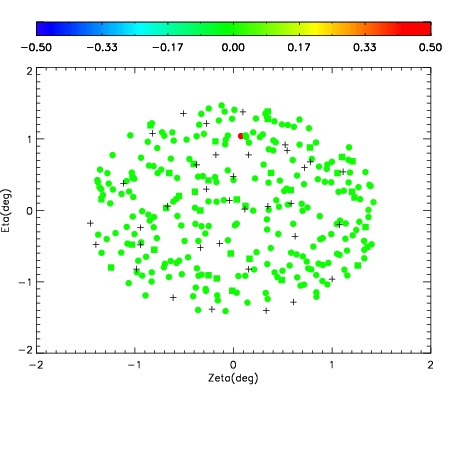
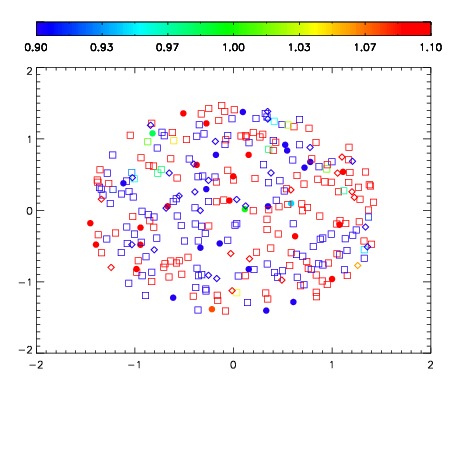
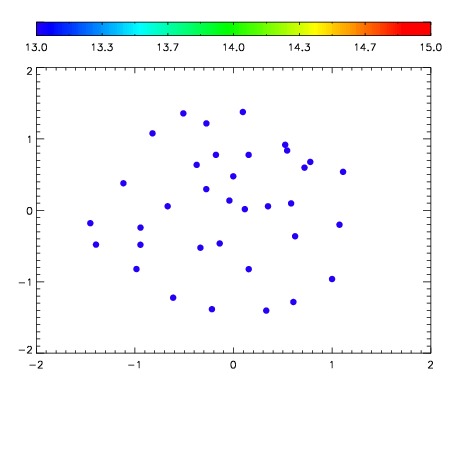

| Frame | Nreads | Zeropoints | Mag plots | Spatial mag deviation | Spatial sky 16325A emission deviations (filled: sky, open: star) | Spatial sky continuum emission | Spatial sky telluric CO2 absorption deviations (filled: H < 10) | |||||||||||||||||||||||
| 0 | 0 |
|
|
|
|
|
|
| IPAIR | NAME | SHIFT | NEWSHIFT | S/N | NAME | SHIFT | NEWSHIFT | S/N |
| 0 | 10460076 | 0.504333 | 0.00000 | 164.346 | 10460074 | 0.00326440 | 0.501069 | 165.723 |
| 1 | 10460071 | 0.503248 | 0.00108504 | 181.080 | 10460073 | 0.00395256 | 0.500380 | 181.712 |
| 2 | 10460072 | 0.503407 | 0.000926018 | 173.050 | 10460070 | 0.00000 | 0.504333 | 179.492 |
| 3 | 10460075 | 0.503804 | 0.000528991 | 169.830 | 10460077 | 0.00333806 | 0.500995 | 165.918 |