| Red | Green | Blue | |
| z | 17.64 | ||
| znorm | Inf | ||
| sky | -Inf | -Inf | -Inf |
| S/N | 26.0 | 45.4 | 57.2 |
| S/N(c) | 0.0 | 0.0 | 0.0 |
| SN(E/C) |
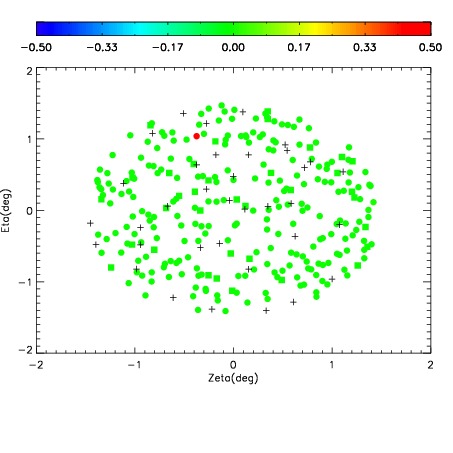
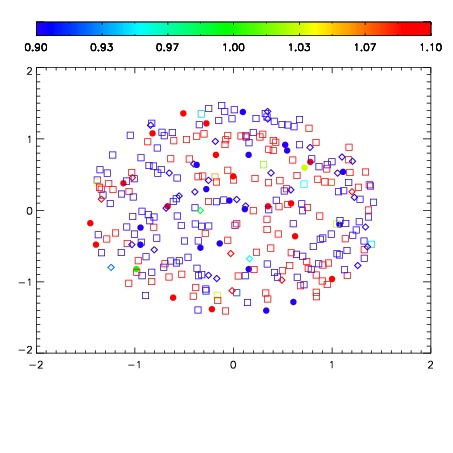
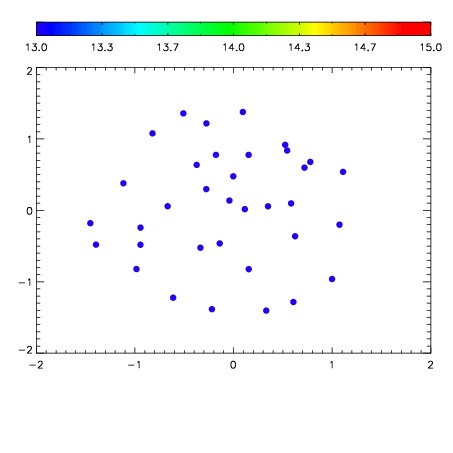

| Frame | Nreads | Zeropoints | Mag plots | Spatial mag deviation | Spatial sky 16325A emission deviations (filled: sky, open: star) | Spatial sky continuum emission | Spatial sky telluric CO2 absorption deviations (filled: H < 10) | |||||||||||||||||||||||
| 0 | 0 |
|
|
|
|
|
|
| IPAIR | NAME | SHIFT | NEWSHIFT | S/N | NAME | SHIFT | NEWSHIFT | S/N |
| 0 | 10750065 | 0.492598 | 0.00000 | 213.117 | 10750067 | -0.00164130 | 0.494239 | 213.370 |
| 1 | 10750064 | 0.492006 | 0.000591993 | 216.888 | 10750063 | -0.000650370 | 0.493248 | 220.973 |
| 2 | 10750068 | 0.491514 | 0.00108400 | 216.215 | 10750062 | -0.000367093 | 0.492965 | 219.269 |
| 3 | 10750060 | 0.490174 | 0.00242400 | 214.994 | 10750066 | -0.00162247 | 0.494220 | 217.000 |
| 4 | 10750061 | 0.490397 | 0.00220099 | 210.354 | 10750059 | 0.00000 | 0.492598 | 211.810 |