| Red | Green | Blue | |
| z | 17.64 | ||
| znorm | Inf | ||
| sky | -Inf | -Inf | -Inf |
| S/N | 22.9 | 42.3 | 47.3 |
| S/N(c) | 0.0 | 0.0 | 0.0 |
| SN(E/C) |
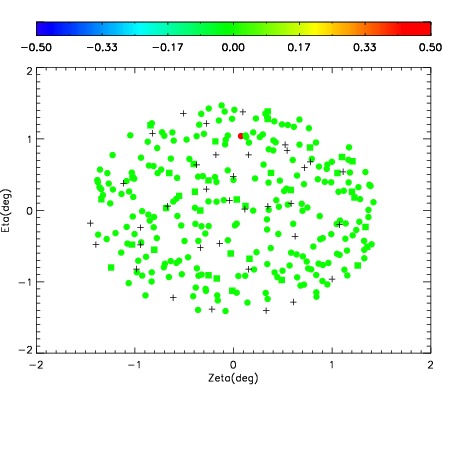
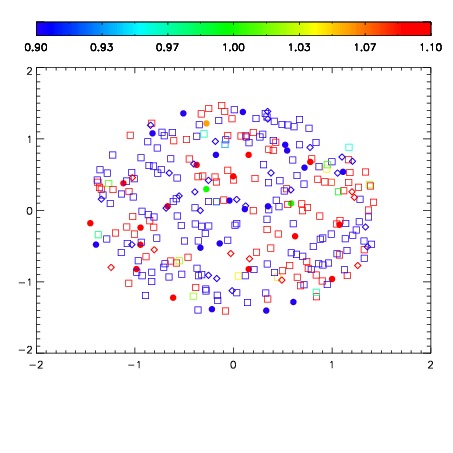
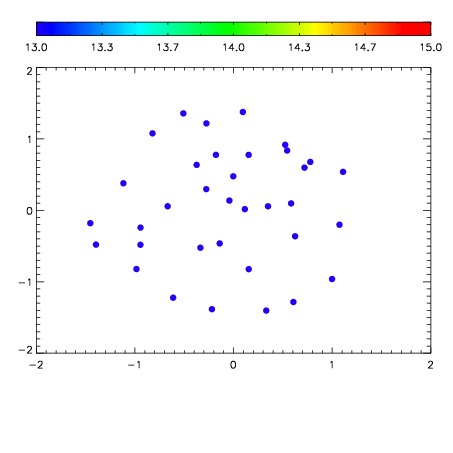

| Frame | Nreads | Zeropoints | Mag plots | Spatial mag deviation | Spatial sky 16325A emission deviations (filled: sky, open: star) | Spatial sky continuum emission | Spatial sky telluric CO2 absorption deviations (filled: H < 10) | |||||||||||||||||||||||
| 0 | 0 |
|
|
|
|
|
|
| IPAIR | NAME | SHIFT | NEWSHIFT | S/N | NAME | SHIFT | NEWSHIFT | S/N |
| 0 | 10840056 | 0.490246 | 0.00000 | 182.557 | 10840050 | 0.00000 | 0.490246 | 187.239 |
| 1 | 10840052 | 0.489075 | 0.00117099 | 190.203 | 10840054 | -0.00165367 | 0.491900 | 195.692 |
| 2 | 10840051 | 0.489499 | 0.000746995 | 184.083 | 10840053 | -0.00174472 | 0.491991 | 193.234 |
| 3 | 10840055 | 0.489303 | 0.000943005 | 173.923 | 10840057 | 0.000130007 | 0.490116 | 178.422 |
| 4 | 10840059 | 0.489962 | 0.000283986 | 140.307 | 10840058 | 0.000223942 | 0.490022 | 150.804 |