| Red | Green | Blue | |
| z | 17.64 | ||
| znorm | Inf | ||
| sky | -Inf | -Inf | -Inf |
| S/N | 18.7 | 35.9 | 37.1 |
| S/N(c) | 0.0 | 0.0 | 0.0 |
| SN(E/C) |

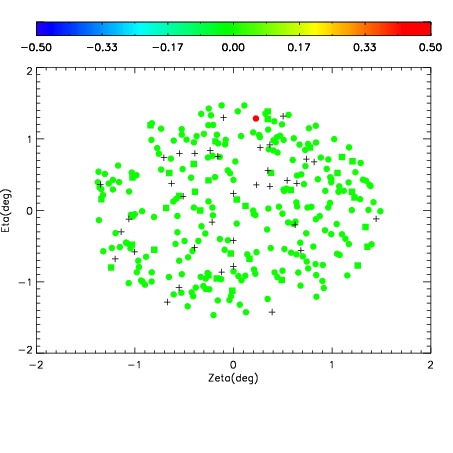
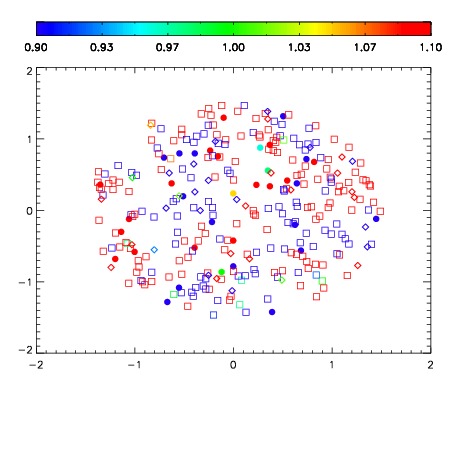


| Frame | Nreads | Zeropoints | Mag plots | Spatial mag deviation | Spatial sky 16325A emission deviations (filled: sky, open: star) | Spatial sky continuum emission | Spatial sky telluric CO2 absorption deviations (filled: H < 10) | |||||||||||||||||||||||
| 0 | 0 |
|
|
|
|
|
|
| IPAIR | NAME | SHIFT | NEWSHIFT | S/N | NAME | SHIFT | NEWSHIFT | S/N |
| 0 | 10790060 | 0.496917 | 0.00000 | 139.313 | 10790058 | 0.00000 | 0.496917 | 155.079 |
| 1 | 10790064 | 0.495664 | 0.00125301 | 186.267 | 10790065 | -0.00257679 | 0.499494 | 193.975 |
| 2 | 10790063 | 0.495202 | 0.00171500 | 161.307 | 10790062 | -0.00100606 | 0.497923 | 155.222 |
| 3 | 10790059 | 0.496624 | 0.000293016 | 136.558 | 10790061 | -0.000224590 | 0.497142 | 142.742 |