| Red | Green | Blue | |
| z | 17.64 | ||
| znorm | Inf | ||
| sky | -NaN | -NaN | -Inf |
| S/N | 30.8 | 49.3 | 59.3 |
| S/N(c) | 0.0 | 0.0 | 0.0 |
| SN(E/C) |
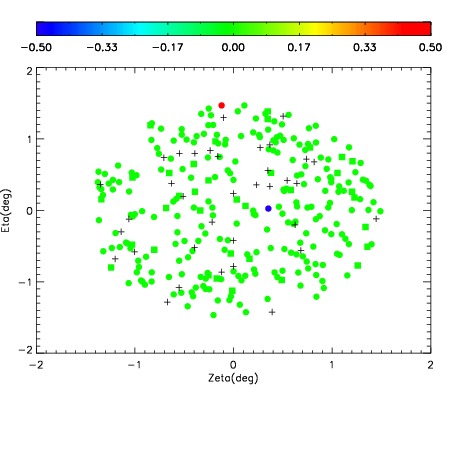
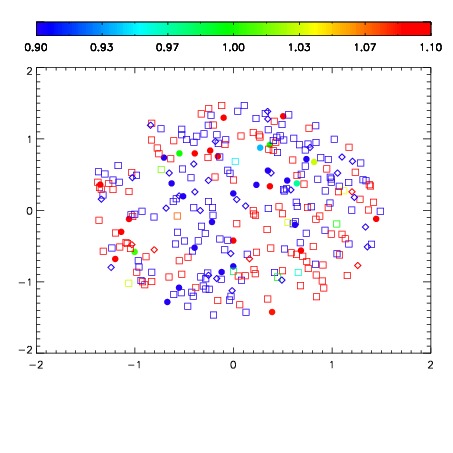
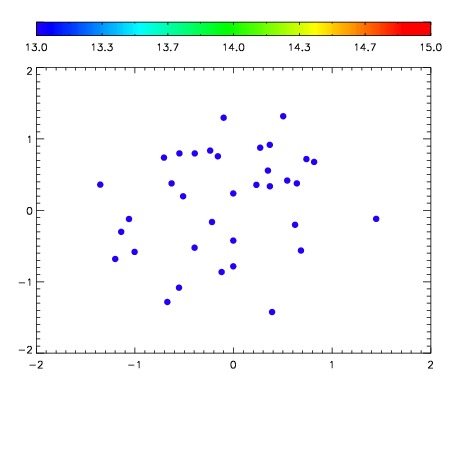

| Frame | Nreads | Zeropoints | Mag plots | Spatial mag deviation | Spatial sky 16325A emission deviations (filled: sky, open: star) | Spatial sky continuum emission | Spatial sky telluric CO2 absorption deviations (filled: H < 10) | |||||||||||||||||||||||
| 0 | 0 |
|
|
|
|
|
|
| IPAIR | NAME | SHIFT | NEWSHIFT | S/N | NAME | SHIFT | NEWSHIFT | S/N |
| 0 | 10880060 | 0.503305 | 0.00000 | 240.039 | 10880062 | -0.00111787 | 0.504423 | 238.753 |
| 1 | 10880059 | 0.501877 | 0.00142801 | 238.885 | 10880058 | 0.00000 | 0.503305 | 237.891 |
| 2 | 10880064 | 0.501799 | 0.00150603 | 230.523 | 10880061 | -0.00104400 | 0.504349 | 236.516 |
| 3 | 10880063 | 0.500830 | 0.00247502 | 224.475 | 10880065 | -0.000805793 | 0.504111 | 228.554 |