| Red | Green | Blue | |
| z | 17.64 | ||
| znorm | Inf | ||
| sky | -Inf | -Inf | -Inf |
| S/N | 26.8 | 47.6 | 48.2 |
| S/N(c) | 0.0 | 0.0 | 0.0 |
| SN(E/C) |
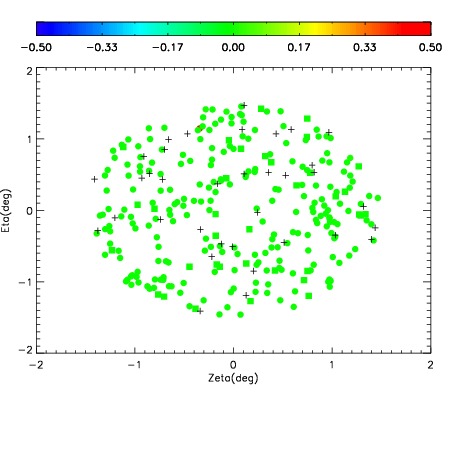
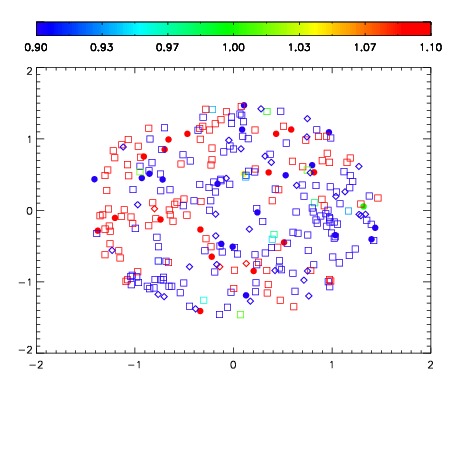
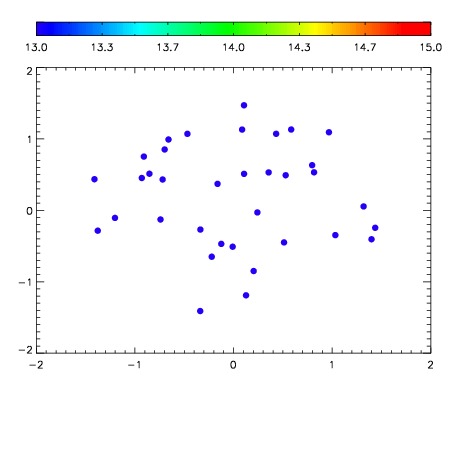

| Frame | Nreads | Zeropoints | Mag plots | Spatial mag deviation | Spatial sky 16325A emission deviations (filled: sky, open: star) | Spatial sky continuum emission | Spatial sky telluric CO2 absorption deviations (filled: H < 10) | |||||||||||||||||||||||
| 0 | 0 |
|
|
|
|
|
|
| IPAIR | NAME | SHIFT | NEWSHIFT | S/N | NAME | SHIFT | NEWSHIFT | S/N |
| 0 | 10920042 | 0.518246 | 0.00000 | 195.040 | 10920041 | 0.00000 | 0.518246 | 197.110 |
| 1 | 10920047 | 0.517154 | 0.00109202 | 198.276 | 10920044 | -0.00292609 | 0.521172 | 199.060 |
| 2 | 10920046 | 0.516482 | 0.00176400 | 197.693 | 10920045 | -0.00350180 | 0.521748 | 198.805 |
| 3 | 10920043 | 0.518184 | 6.19888e-05 | 196.544 | 10920048 | -0.00215596 | 0.520402 | 197.345 |