| Red | Green | Blue | |
| z | 17.64 | ||
| znorm | Inf | ||
| sky | -Inf | -Inf | -Inf |
| S/N | 21.4 | 39.8 | 40.8 |
| S/N(c) | 0.0 | 0.0 | 0.0 |
| SN(E/C) |
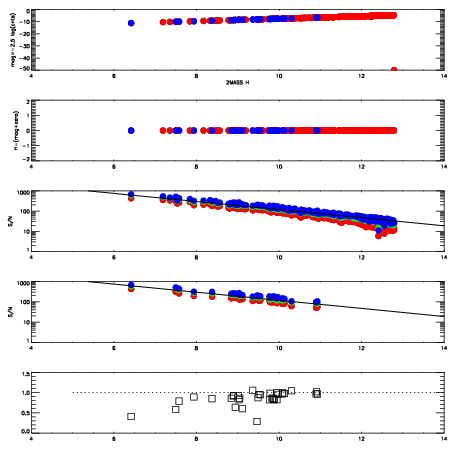
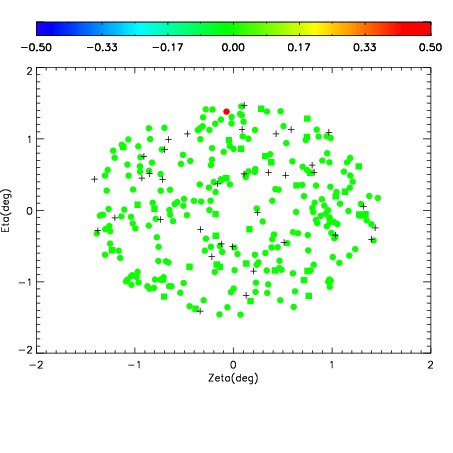
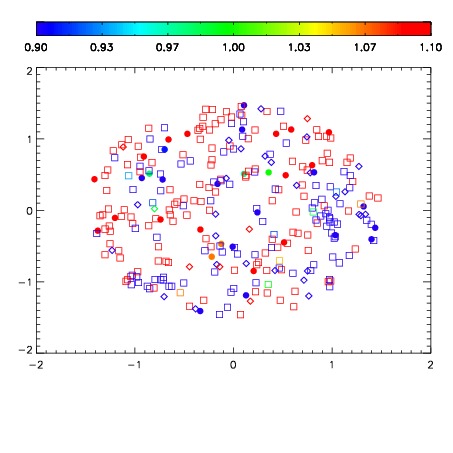
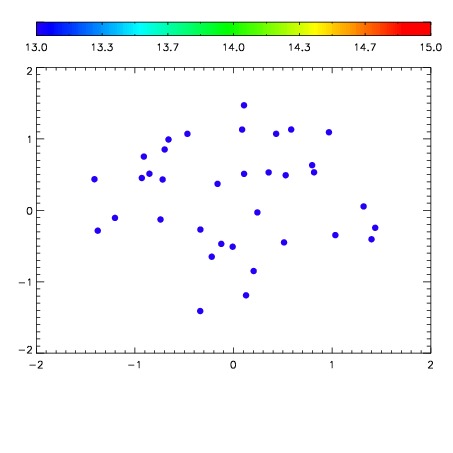

| Frame | Nreads | Zeropoints | Mag plots | Spatial mag deviation | Spatial sky 16325A emission deviations (filled: sky, open: star) | Spatial sky continuum emission | Spatial sky telluric CO2 absorption deviations (filled: H < 10) | |||||||||||||||||||||||
| 0 | 0 |
|
|
|
|
|
|
| IPAIR | NAME | SHIFT | NEWSHIFT | S/N | NAME | SHIFT | NEWSHIFT | S/N |
| 0 | 11060058 | 0.482037 | 0.00000 | 156.539 | 11060059 | -0.00275928 | 0.484796 | 156.418 |
| 1 | 11060053 | 0.480557 | 0.00148001 | 159.356 | 11060055 | -0.000962989 | 0.483000 | 165.029 |
| 2 | 11060054 | 0.480470 | 0.00156701 | 157.720 | 11060052 | 0.00000 | 0.482037 | 156.541 |
| 3 | 11060057 | 0.481327 | 0.000710011 | 154.652 | 11060056 | -0.000590684 | 0.482628 | 151.684 |