| Red | Green | Blue | |
| z | 17.64 | ||
| znorm | Inf | ||
| sky | -NaN | -Inf | -Inf |
| S/N | 23.1 | 42.6 | 44.1 |
| S/N(c) | 0.0 | 0.0 | 0.0 |
| SN(E/C) |
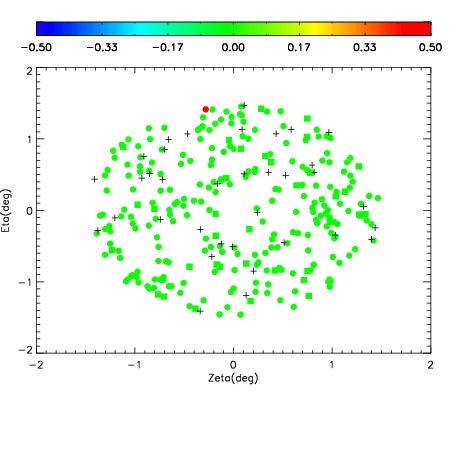
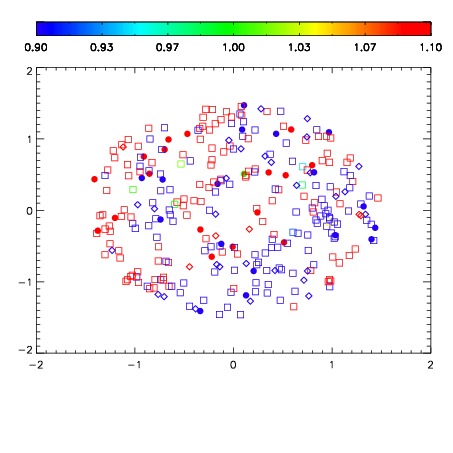
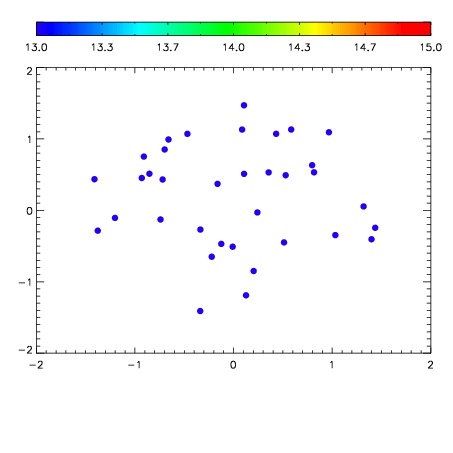

| Frame | Nreads | Zeropoints | Mag plots | Spatial mag deviation | Spatial sky 16325A emission deviations (filled: sky, open: star) | Spatial sky continuum emission | Spatial sky telluric CO2 absorption deviations (filled: H < 10) | |||||||||||||||||||||||
| 0 | 0 |
|
|
|
|
|
|
| IPAIR | NAME | SHIFT | NEWSHIFT | S/N | NAME | SHIFT | NEWSHIFT | S/N |
| 0 | 11340028 | 0.481328 | 0.00000 | 182.100 | 11340030 | -0.00328218 | 0.484610 | 182.683 |
| 1 | 11340029 | 0.481238 | 9.00030e-05 | 180.610 | 11340027 | -0.00180627 | 0.483134 | 182.432 |
| 2 | 11340025 | 0.480406 | 0.000922024 | 180.536 | 11340026 | -0.00117615 | 0.482504 | 180.012 |
| 3 | 11340024 | 0.480575 | 0.000753015 | 176.873 | 11340023 | 0.00000 | 0.481328 | 172.372 |