| Red | Green | Blue | |
| z | 17.64 | ||
| znorm | Inf | ||
| sky | -Inf | -Inf | -Inf |
| S/N | 22.9 | 41.2 | 41.5 |
| S/N(c) | 0.0 | 0.0 | 0.0 |
| SN(E/C) |
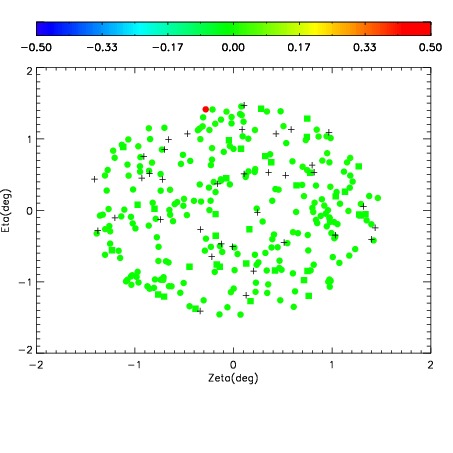
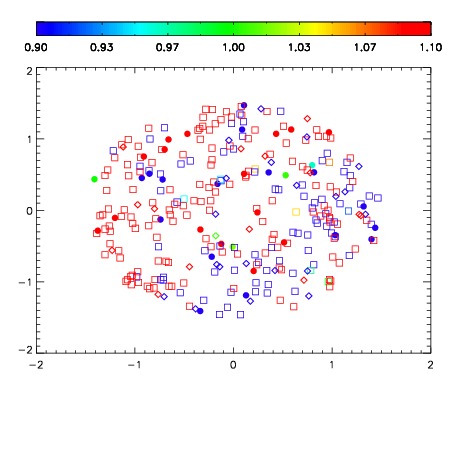
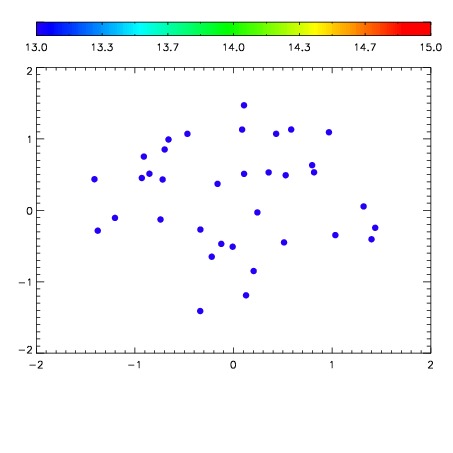

| Frame | Nreads | Zeropoints | Mag plots | Spatial mag deviation | Spatial sky 16325A emission deviations (filled: sky, open: star) | Spatial sky continuum emission | Spatial sky telluric CO2 absorption deviations (filled: H < 10) | |||||||||||||||||||||||
| 0 | 0 |
|
|
|
|
|
|
| IPAIR | NAME | SHIFT | NEWSHIFT | S/N | NAME | SHIFT | NEWSHIFT | S/N |
| 0 | 11680015 | 0.492170 | 0.00000 | 188.569 | 11680014 | -0.00146143 | 0.493631 | 180.430 |
| 1 | 11680016 | 0.491979 | 0.000191003 | 191.489 | 11680017 | -0.000817389 | 0.492987 | 192.127 |
| 2 | 11680012 | 0.491126 | 0.00104401 | 173.265 | 11680010 | 0.00000 | 0.492170 | 172.034 |
| 3 | 11680011 | 0.490457 | 0.00171301 | 172.363 | 11680013 | -0.00155120 | 0.493721 | 168.685 |