| Red | Green | Blue | |
| z | 17.64 | ||
| znorm | Inf | ||
| sky | -Inf | -NaN | -Inf |
| S/N | 26.3 | 45.3 | 51.2 |
| S/N(c) | 0.0 | 0.0 | 0.0 |
| SN(E/C) |
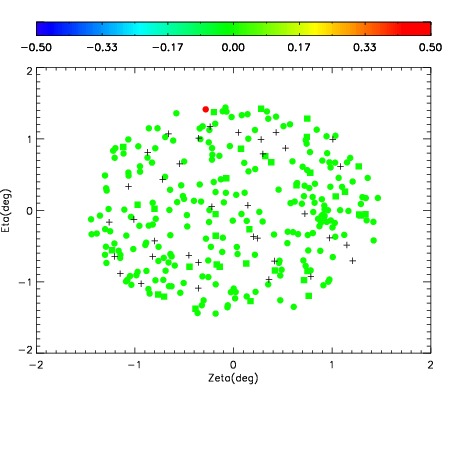
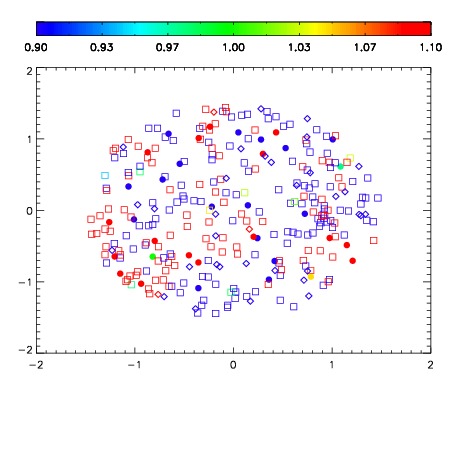
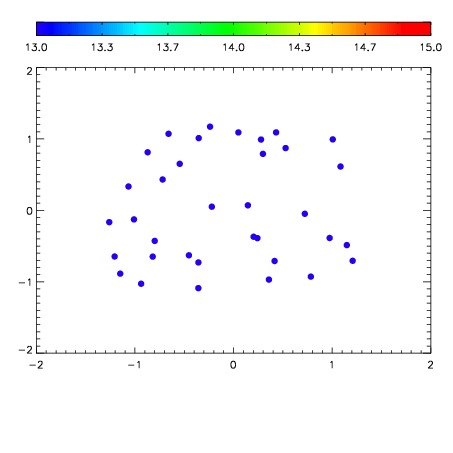

| Frame | Nreads | Zeropoints | Mag plots | Spatial mag deviation | Spatial sky 16325A emission deviations (filled: sky, open: star) | Spatial sky continuum emission | Spatial sky telluric CO2 absorption deviations (filled: H < 10) | |||||||||||||||||||||||
| 0 | 0 |
|
|
|
|
|
|
| IPAIR | NAME | SHIFT | NEWSHIFT | S/N | NAME | SHIFT | NEWSHIFT | S/N |
| 0 | 11130039 | 0.484833 | 0.00000 | 178.213 | 11130040 | -0.00224773 | 0.487081 | 183.236 |
| 1 | 11130035 | 0.484313 | 0.000519991 | 175.030 | 11130036 | -0.00222948 | 0.487062 | 171.968 |
| 2 | 11130038 | 0.483488 | 0.00134501 | 172.031 | 11130037 | -0.00212206 | 0.486955 | 165.118 |
| 3 | 11130034 | 0.484533 | 0.000299990 | 158.143 | 11130033 | 0.00000 | 0.484833 | 161.778 |