| Red | Green | Blue | |
| z | 17.64 | ||
| znorm | Inf | ||
| sky | -Inf | -Inf | -Inf |
| S/N | 24.0 | 39.0 | 44.5 |
| S/N(c) | 0.0 | 0.0 | 0.0 |
| SN(E/C) |
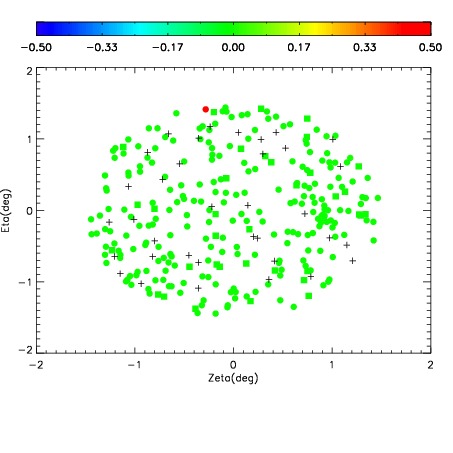
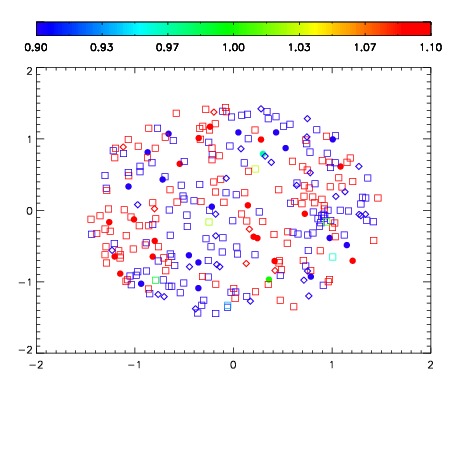
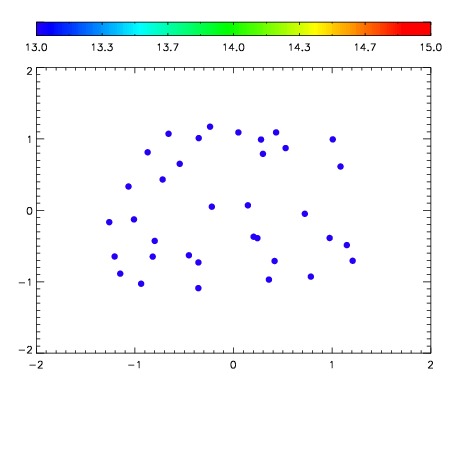

| Frame | Nreads | Zeropoints | Mag plots | Spatial mag deviation | Spatial sky 16325A emission deviations (filled: sky, open: star) | Spatial sky continuum emission | Spatial sky telluric CO2 absorption deviations (filled: H < 10) | |||||||||||||||||||||||
| 0 | 0 |
|
|
|
|
|
|
| IPAIR | NAME | SHIFT | NEWSHIFT | S/N | NAME | SHIFT | NEWSHIFT | S/N |
| 0 | 11350027 | 0.480128 | 0.00000 | 169.443 | 11350024 | -0.00151552 | 0.481643 | 169.294 |
| 1 | 11350026 | 0.479227 | 0.000900984 | 169.838 | 11350028 | -0.000393803 | 0.480522 | 176.613 |
| 2 | 11350023 | 0.478153 | 0.00197500 | 166.934 | 11350025 | -0.00132275 | 0.481451 | 166.030 |
| 3 | 11350022 | 0.477915 | 0.00221300 | 159.091 | 11350021 | 0.00000 | 0.480128 | 153.259 |