| Red | Green | Blue | |
| z | 17.64 | ||
| znorm | Inf | ||
| sky | -Inf | -NaN | -Inf |
| S/N | 27.9 | 45.0 | 50.6 |
| S/N(c) | 0.0 | 0.0 | 0.0 |
| SN(E/C) |
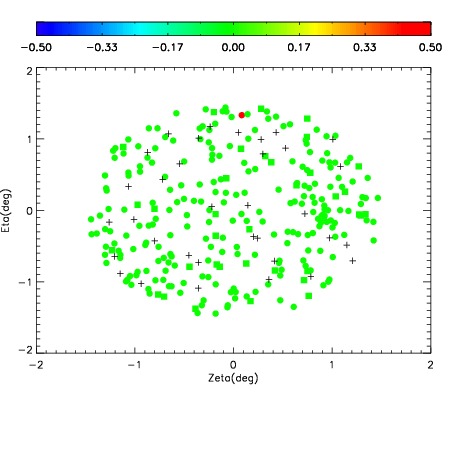
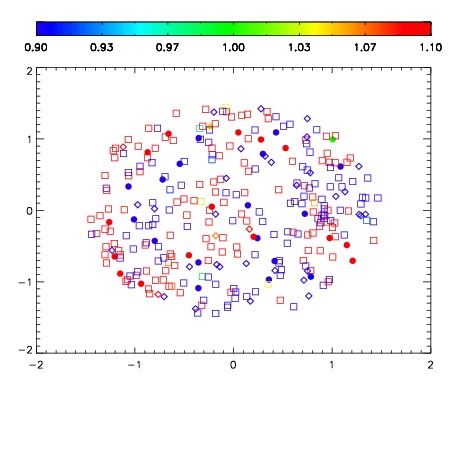


| Frame | Nreads | Zeropoints | Mag plots | Spatial mag deviation | Spatial sky 16325A emission deviations (filled: sky, open: star) | Spatial sky continuum emission | Spatial sky telluric CO2 absorption deviations (filled: H < 10) | |||||||||||||||||||||||
| 0 | 0 |
|
|
|
|
|
|
| IPAIR | NAME | SHIFT | NEWSHIFT | S/N | NAME | SHIFT | NEWSHIFT | S/N |
| 0 | 11380032 | 0.478244 | 0.00000 | 187.275 | 11380033 | 0.00162689 | 0.476617 | 186.681 |
| 1 | 11380031 | 0.477490 | 0.000753999 | 186.400 | 11380029 | -0.000397840 | 0.478642 | 183.058 |
| 2 | 11380028 | 0.475643 | 0.00260100 | 183.055 | 11380026 | 0.00000 | 0.478244 | 180.303 |
| 3 | 11380027 | 0.474721 | 0.00352299 | 179.176 | 11380030 | 2.12564e-05 | 0.478223 | 171.266 |