| Red | Green | Blue | |
| z | 17.64 | ||
| znorm | Inf | ||
| sky | -Inf | -NaN | -Inf |
| S/N | 35.1 | 60.1 | 63.4 |
| S/N(c) | 0.0 | 0.0 | 0.0 |
| SN(E/C) |

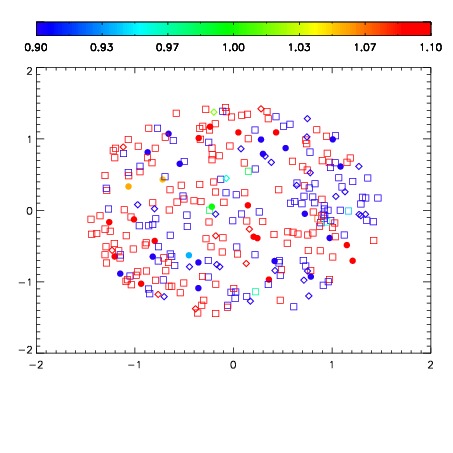
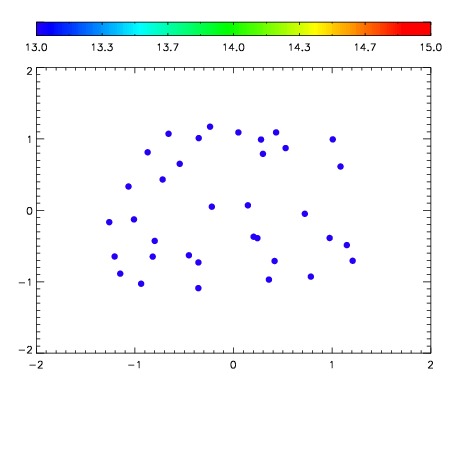

| Frame | Nreads | Zeropoints | Mag plots | Spatial mag deviation | Spatial sky 16325A emission deviations (filled: sky, open: star) | Spatial sky continuum emission | Spatial sky telluric CO2 absorption deviations (filled: H < 10) | |||||||||||||||||||||||
| 0 | 0 |
|
|
|
|
|
|
| IPAIR | NAME | SHIFT | NEWSHIFT | S/N | NAME | SHIFT | NEWSHIFT | S/N |
| 0 | 11660013 | 0.487588 | 0.00000 | 201.970 | 11660018 | -0.0109930 | 0.498581 | 205.240 |
| 1 | 11660016 | 0.485465 | 0.00212300 | 203.194 | 11660014 | -0.00861912 | 0.496207 | 208.249 |
| 2 | 11660017 | 0.486692 | 0.000895977 | 201.742 | 11660015 | -0.00908017 | 0.496668 | 205.210 |
| 3 | 11660012 | 0.487379 | 0.000208974 | 196.509 | 11660019 | -0.0100531 | 0.497641 | 200.318 |
| 4 | 11660020 | 0.486140 | 0.00144798 | 188.635 | 11660022 | -0.00907652 | 0.496664 | 193.239 |
| 5 | 11660021 | 0.486070 | 0.00151798 | 186.143 | 11660011 | 0.00000 | 0.487588 | 189.403 |