| Red | Green | Blue | |
| z | 17.64 | ||
| znorm | Inf | ||
| sky | -Inf | -Inf | -Inf |
| S/N | 26.7 | 47.6 | 51.6 |
| S/N(c) | 0.0 | 0.0 | 0.0 |
| SN(E/C) |
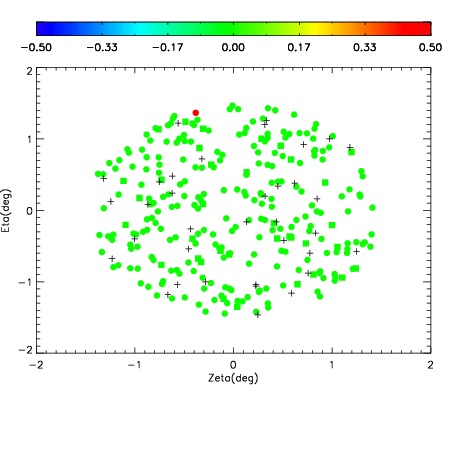
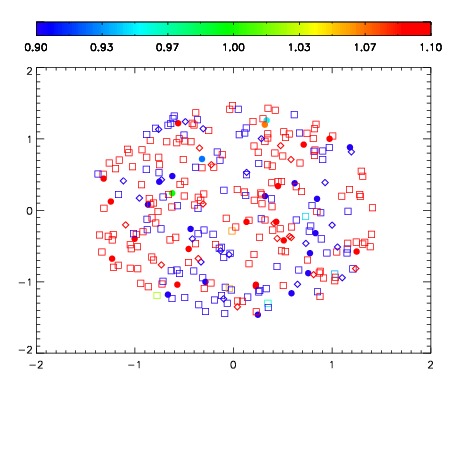
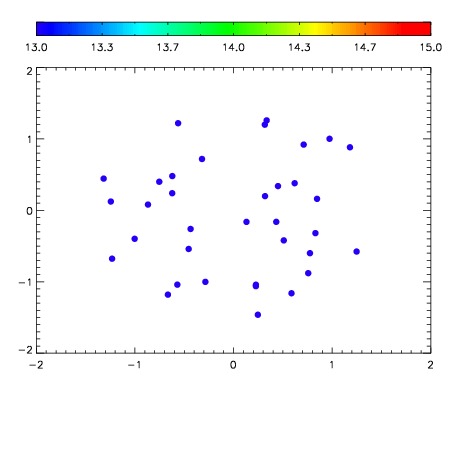

| Frame | Nreads | Zeropoints | Mag plots | Spatial mag deviation | Spatial sky 16325A emission deviations (filled: sky, open: star) | Spatial sky continuum emission | Spatial sky telluric CO2 absorption deviations (filled: H < 10) | |||||||||||||||||||||||
| 0 | 0 |
|
|
|
|
|
|
| IPAIR | NAME | SHIFT | NEWSHIFT | S/N | NAME | SHIFT | NEWSHIFT | S/N |
| 0 | 11660036 | 0.492284 | 0.00000 | 221.947 | 11660030 | 0.00000 | 0.492284 | 209.788 |
| 1 | 11660032 | 0.491989 | 0.000295013 | 230.071 | 11660033 | -0.00601444 | 0.498298 | 229.065 |
| 2 | 11660031 | 0.491740 | 0.000544012 | 223.494 | 11660034 | -0.00572231 | 0.498006 | 221.119 |
| 3 | 11660035 | 0.491123 | 0.00116101 | 222.308 | 11660037 | -0.00528439 | 0.497568 | 211.845 |