| Red | Green | Blue | |
| z | 17.64 | ||
| znorm | Inf | ||
| sky | -Inf | -Inf | -Inf |
| S/N | 23.1 | 42.2 | 45.7 |
| S/N(c) | 0.0 | 0.0 | 0.0 |
| SN(E/C) |
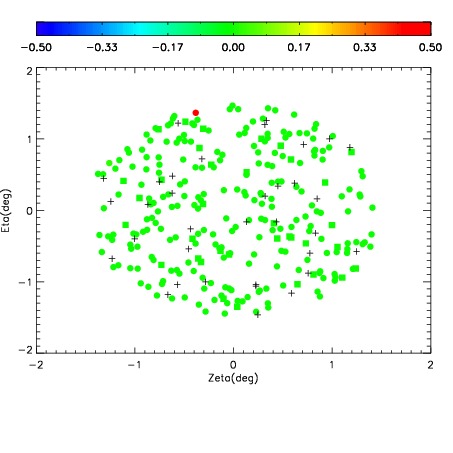
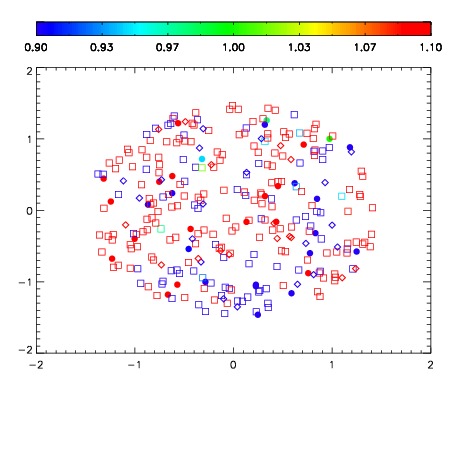
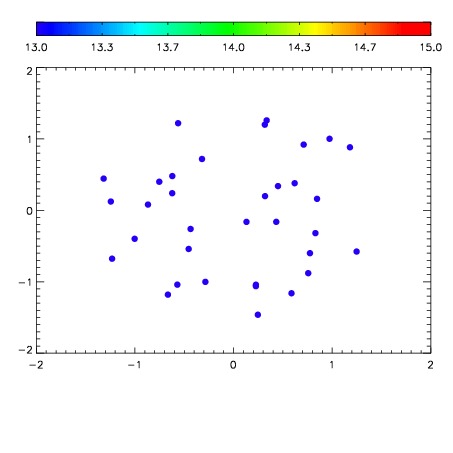

| Frame | Nreads | Zeropoints | Mag plots | Spatial mag deviation | Spatial sky 16325A emission deviations (filled: sky, open: star) | Spatial sky continuum emission | Spatial sky telluric CO2 absorption deviations (filled: H < 10) | |||||||||||||||||||||||
| 0 | 0 |
|
|
|
|
|
|
| IPAIR | NAME | SHIFT | NEWSHIFT | S/N | NAME | SHIFT | NEWSHIFT | S/N |
| 0 | 11720016 | 0.489263 | 0.00000 | 205.615 | 11720014 | -0.000966709 | 0.490230 | 206.264 |
| 1 | 11720012 | 0.488037 | 0.00122601 | 207.280 | 11720015 | -0.00116749 | 0.490430 | 208.280 |
| 2 | 11720017 | 0.488798 | 0.000465006 | 202.556 | 11720018 | -0.00352042 | 0.492783 | 205.113 |
| 3 | 11720013 | 0.488659 | 0.000604004 | 193.048 | 11720011 | 0.00000 | 0.489263 | 198.639 |