| Red | Green | Blue | |
| z | 17.64 | ||
| znorm | Inf | ||
| sky | -Inf | -Inf | -Inf |
| S/N | 24.5 | 44.7 | 47.1 |
| S/N(c) | 0.0 | 0.0 | 0.0 |
| SN(E/C) |
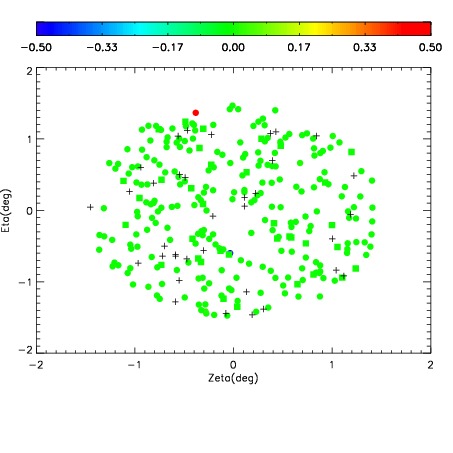
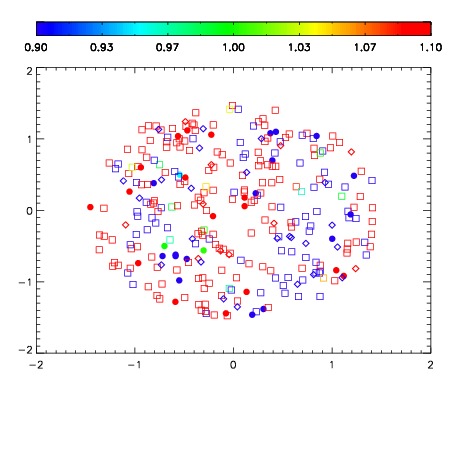
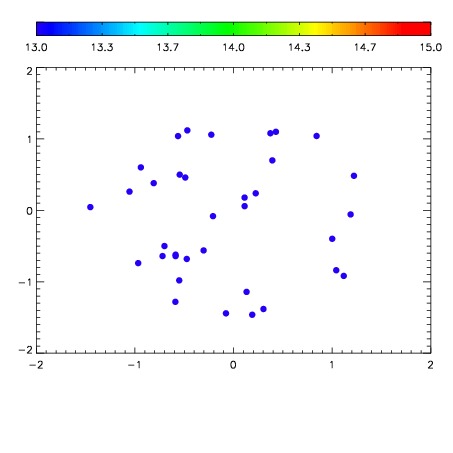

| Frame | Nreads | Zeropoints | Mag plots | Spatial mag deviation | Spatial sky 16325A emission deviations (filled: sky, open: star) | Spatial sky continuum emission | Spatial sky telluric CO2 absorption deviations (filled: H < 10) | |||||||||||||||||||||||
| 0 | 0 |
|
|
|
|
|
|
| IPAIR | NAME | SHIFT | NEWSHIFT | S/N | NAME | SHIFT | NEWSHIFT | S/N |
| 0 | 11670027 | 0.498757 | 0.00000 | 86.1330 | 11670025 | 0.00000 | 0.498757 | 80.7861 |
| 1 | 11670031 | 0.495962 | 0.00279501 | 101.722 | 11670032 | -0.00170162 | 0.500459 | 100.689 |
| 2 | 11670030 | 0.495318 | 0.00343901 | 101.136 | 11670028 | -0.00164007 | 0.500397 | 99.6964 |
| 3 | 11670026 | 0.498518 | 0.000239015 | 94.5385 | 11670029 | -0.00138213 | 0.500139 | 93.1923 |