| Red | Green | Blue | |
| z | 17.64 | ||
| znorm | Inf | ||
| sky | -Inf | -Inf | -Inf |
| S/N | 19.3 | 36.7 | 40.4 |
| S/N(c) | 0.0 | 0.0 | 0.0 |
| SN(E/C) |
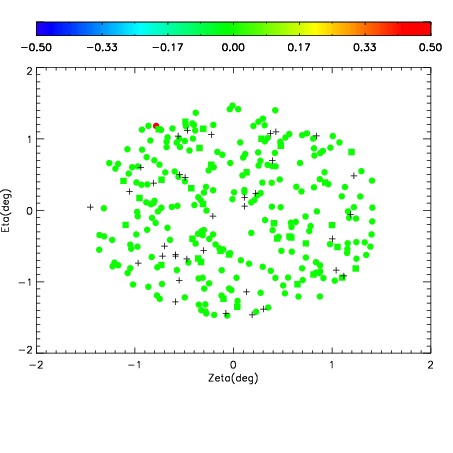
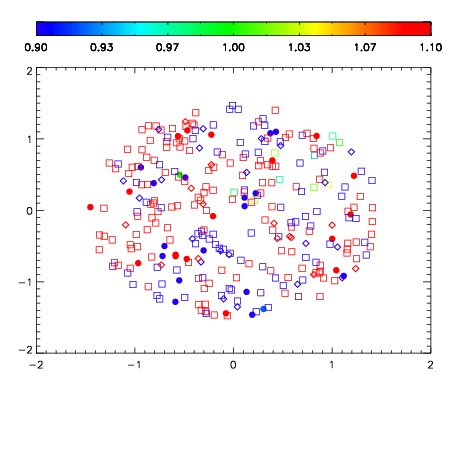
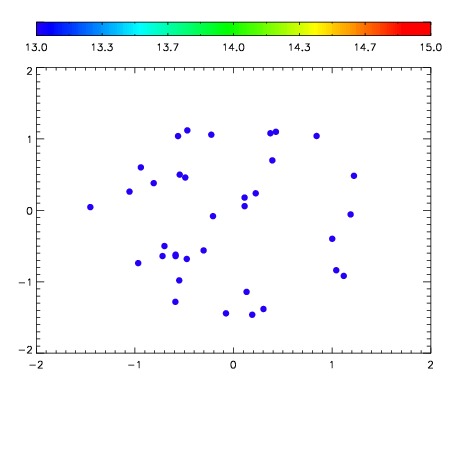

| Frame | Nreads | Zeropoints | Mag plots | Spatial mag deviation | Spatial sky 16325A emission deviations (filled: sky, open: star) | Spatial sky continuum emission | Spatial sky telluric CO2 absorption deviations (filled: H < 10) | |||||||||||||||||||||||
| 0 | 0 |
|
|
|
|
|
|
| IPAIR | NAME | SHIFT | NEWSHIFT | S/N | NAME | SHIFT | NEWSHIFT | S/N |
| 0 | 11710032 | 0.489220 | 0.00000 | 176.795 | 11710033 | -0.00267281 | 0.491893 | 172.962 |
| 1 | 11710028 | 0.488233 | 0.000986993 | 162.667 | 11710030 | -0.00213399 | 0.491354 | 170.308 |
| 2 | 11710031 | 0.488371 | 0.000848979 | 151.012 | 11710026 | 0.00000 | 0.489220 | 170.079 |
| 3 | 11710027 | 0.488192 | 0.00102800 | 148.984 | 11710029 | -0.00137280 | 0.490593 | 165.294 |