| Red | Green | Blue | |
| z | 17.64 | ||
| znorm | Inf | ||
| sky | -Inf | -Inf | -Inf |
| S/N | 25.6 | 44.3 | 47.4 |
| S/N(c) | 0.0 | 0.0 | 0.0 |
| SN(E/C) |
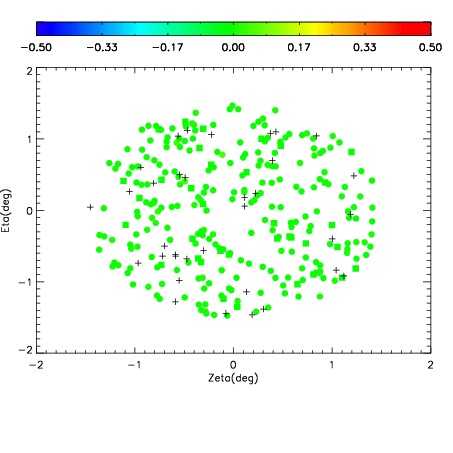
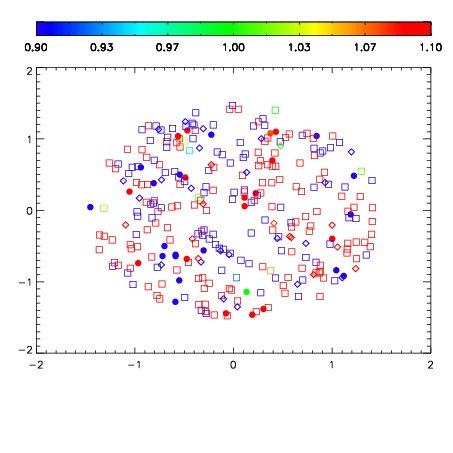
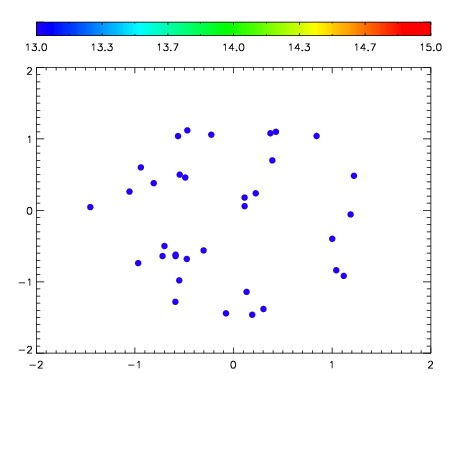

| Frame | Nreads | Zeropoints | Mag plots | Spatial mag deviation | Spatial sky 16325A emission deviations (filled: sky, open: star) | Spatial sky continuum emission | Spatial sky telluric CO2 absorption deviations (filled: H < 10) | |||||||||||||||||||||||
| 0 | 0 |
|
|
|
|
|
|
| IPAIR | NAME | SHIFT | NEWSHIFT | S/N | NAME | SHIFT | NEWSHIFT | S/N |
| 0 | 11950016 | 0.499989 | 0.00000 | 165.525 | 11950010 | 0.00000 | 0.499989 | 187.704 |
| 1 | 11950011 | 0.499844 | 0.000144988 | 164.929 | 11950013 | -0.00277494 | 0.502764 | 166.458 |
| 2 | 11950012 | 0.499919 | 7.00057e-05 | 164.669 | 11950014 | -0.00266989 | 0.502659 | 163.706 |
| 3 | 11950015 | 0.499492 | 0.000497013 | 164.443 | 11950017 | -0.00399473 | 0.503984 | 162.786 |