| Red | Green | Blue | |
| z | 17.64 | ||
| znorm | Inf | ||
| sky | -Inf | -Inf | -Inf |
| S/N | 16.6 | 30.6 | 33.1 |
| S/N(c) | 0.0 | 0.0 | 0.0 |
| SN(E/C) |
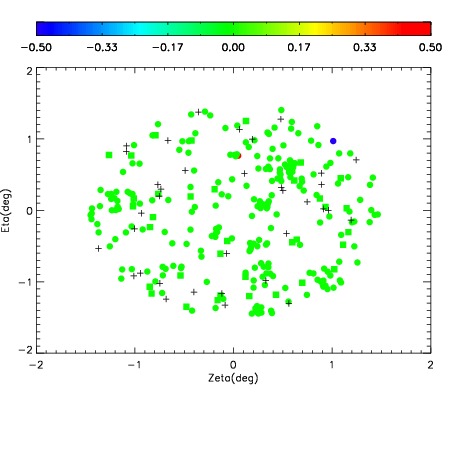
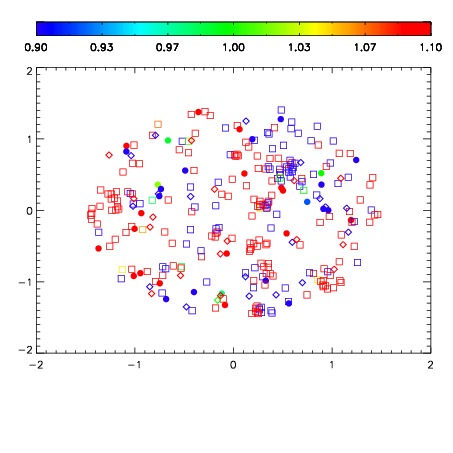
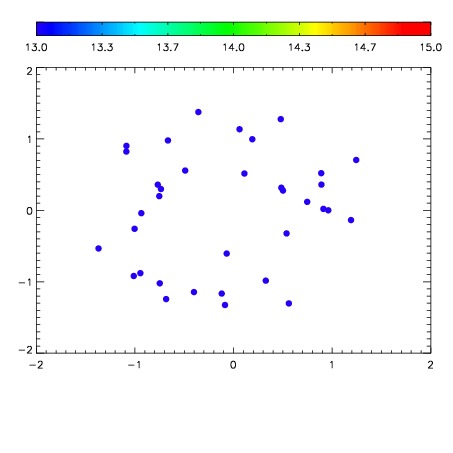

| Frame | Nreads | Zeropoints | Mag plots | Spatial mag deviation | Spatial sky 16325A emission deviations (filled: sky, open: star) | Spatial sky continuum emission | Spatial sky telluric CO2 absorption deviations (filled: H < 10) | |||||||||||||||||||||||
| 0 | 0 |
|
|
|
|
|
|
| IPAIR | NAME | SHIFT | NEWSHIFT | S/N | NAME | SHIFT | NEWSHIFT | S/N |
| 0 | 11080028 | 0.479518 | 0.00000 | 146.331 | 11080030 | 0.000332583 | 0.479185 | 148.912 |
| 1 | 11080031 | 0.477293 | 0.00222498 | 161.342 | 11080033 | -0.000197937 | 0.479716 | 158.045 |
| 2 | 11080032 | 0.477293 | 0.00222498 | 161.292 | 11080029 | 0.000637143 | 0.478881 | 153.979 |
| 3 | 11080027 | 0.478924 | 0.000593990 | 131.909 | 11080026 | 0.00000 | 0.479518 | 146.561 |