| Red | Green | Blue | |
| z | 17.64 | ||
| znorm | Inf | ||
| sky | -Inf | -Inf | -Inf |
| S/N | 24.0 | 40.7 | 45.5 |
| S/N(c) | 0.0 | 0.0 | 0.0 |
| SN(E/C) |


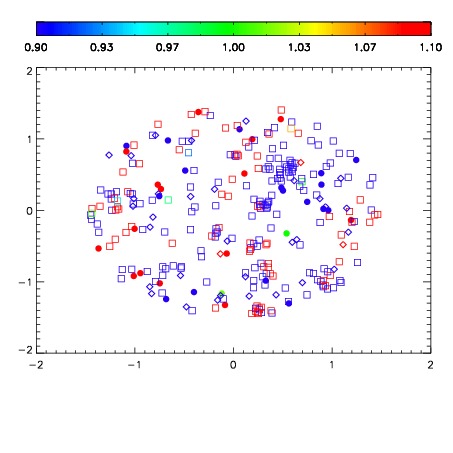
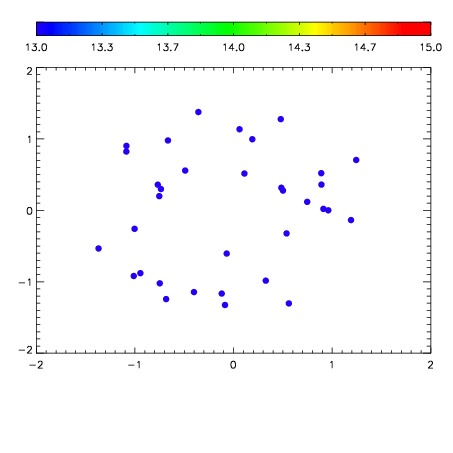

| Frame | Nreads | Zeropoints | Mag plots | Spatial mag deviation | Spatial sky 16325A emission deviations (filled: sky, open: star) | Spatial sky continuum emission | Spatial sky telluric CO2 absorption deviations (filled: H < 10) | |||||||||||||||||||||||
| 0 | 0 |
|
|
|
|
|
|
| IPAIR | NAME | SHIFT | NEWSHIFT | S/N | NAME | SHIFT | NEWSHIFT | S/N |
| 0 | 11120028 | 0.482714 | 0.00000 | 202.860 | 11120033 | -0.000100110 | 0.482814 | 191.402 |
| 1 | 11120031 | 0.481811 | 0.000903010 | 205.392 | 11120029 | -0.00144001 | 0.484154 | 200.004 |
| 2 | 11120032 | 0.482612 | 0.000101984 | 195.201 | 11120026 | 0.00000 | 0.482714 | 188.094 |
| 3 | 11120027 | 0.482495 | 0.000218987 | 192.995 | 11120030 | -0.00101295 | 0.483727 | 178.590 |