| Red | Green | Blue | |
| z | 17.64 | ||
| znorm | Inf | ||
| sky | -Inf | -Inf | -Inf |
| S/N | 25.6 | 43.9 | 47.4 |
| S/N(c) | 0.0 | 0.0 | 0.0 |
| SN(E/C) |
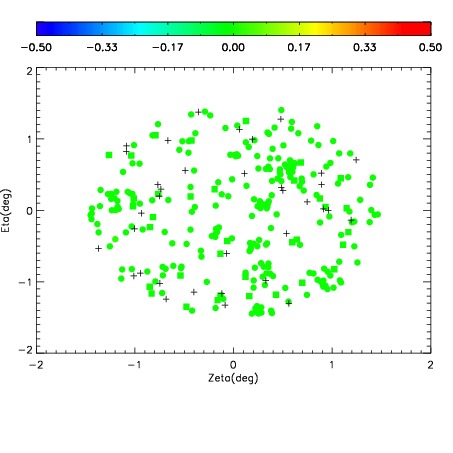
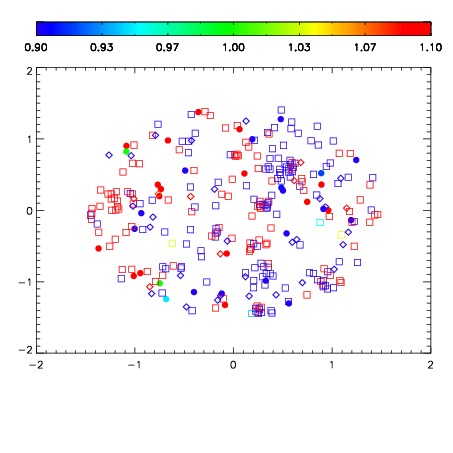
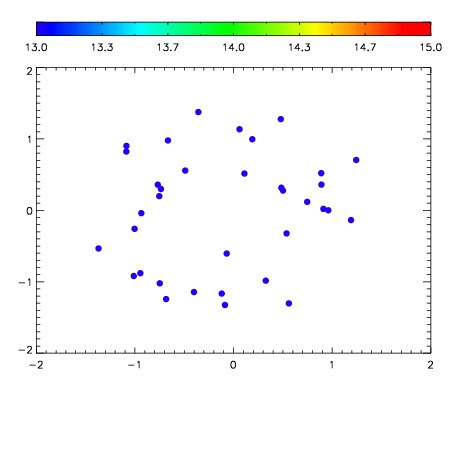

| Frame | Nreads | Zeropoints | Mag plots | Spatial mag deviation | Spatial sky 16325A emission deviations (filled: sky, open: star) | Spatial sky continuum emission | Spatial sky telluric CO2 absorption deviations (filled: H < 10) | |||||||||||||||||||||||
| 0 | 0 |
|
|
|
|
|
|
| IPAIR | NAME | SHIFT | NEWSHIFT | S/N | NAME | SHIFT | NEWSHIFT | S/N |
| 0 | 11380016 | 0.475742 | 0.00000 | 201.454 | 11380015 | -0.000950102 | 0.476692 | 204.362 |
| 1 | 11380013 | 0.475248 | 0.000494003 | 201.383 | 11380014 | -0.00114416 | 0.476886 | 202.573 |
| 2 | 11380012 | 0.475203 | 0.000539005 | 198.554 | 11380018 | -0.00138461 | 0.477127 | 202.385 |
| 3 | 11380017 | 0.475584 | 0.000158012 | 195.037 | 11380011 | 0.00000 | 0.475742 | 194.484 |