| Red | Green | Blue | |
| z | 17.64 | ||
| znorm | Inf | ||
| sky | -Inf | -Inf | -Inf |
| S/N | 24.4 | 41.7 | 46.1 |
| S/N(c) | 0.0 | 0.0 | 0.0 |
| SN(E/C) |
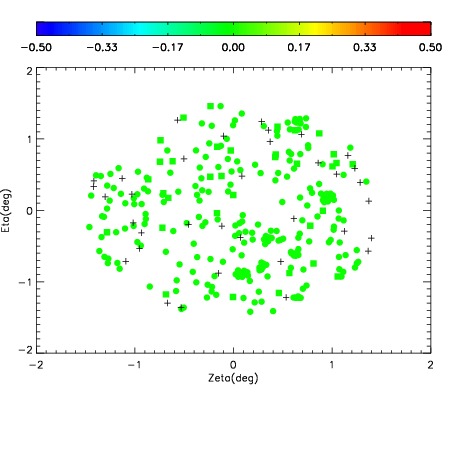
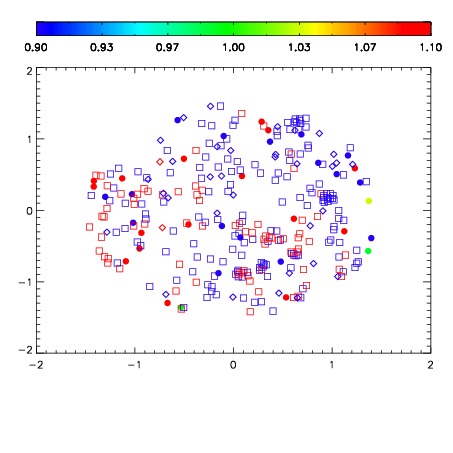
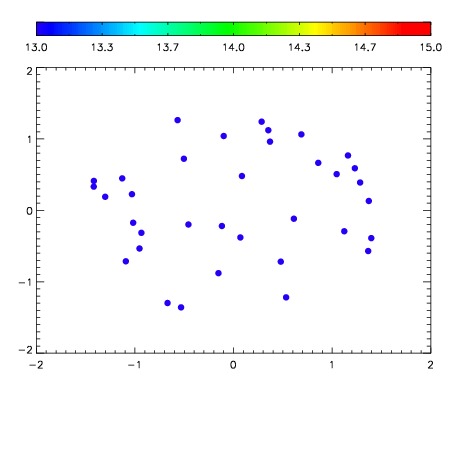

| Frame | Nreads | Zeropoints | Mag plots | Spatial mag deviation | Spatial sky 16325A emission deviations (filled: sky, open: star) | Spatial sky continuum emission | Spatial sky telluric CO2 absorption deviations (filled: H < 10) | |||||||||||||||||||||||
| 0 | 0 |
|
|
|
|
|
|
| IPAIR | NAME | SHIFT | NEWSHIFT | S/N | NAME | SHIFT | NEWSHIFT | S/N |
| 0 | 11100028 | 0.471985 | 0.00000 | 190.688 | 11100026 | 0.00000 | 0.471985 | 191.338 |
| 1 | 11100032 | 0.469013 | 0.00297201 | 193.271 | 11100030 | -0.00196575 | 0.473951 | 191.624 |
| 2 | 11100031 | 0.468966 | 0.00301901 | 187.705 | 11100033 | -0.00244961 | 0.474435 | 190.975 |
| 3 | 11100027 | 0.470966 | 0.00101900 | 182.991 | 11100029 | -0.00209117 | 0.474076 | 186.969 |