| Red | Green | Blue | |
| z | 17.64 | ||
| znorm | Inf | ||
| sky | -Inf | -NaN | -Inf |
| S/N | 22.3 | 39.5 | 41.4 |
| S/N(c) | 0.0 | 0.0 | 0.0 |
| SN(E/C) |
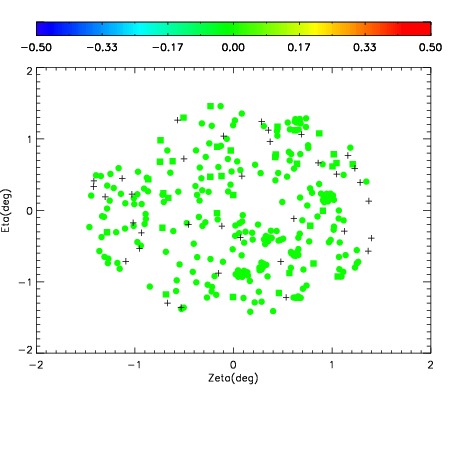
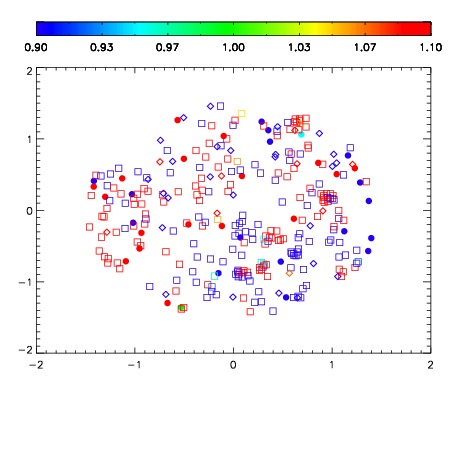
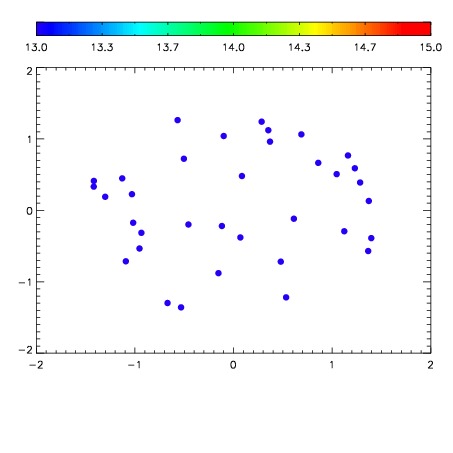

| Frame | Nreads | Zeropoints | Mag plots | Spatial mag deviation | Spatial sky 16325A emission deviations (filled: sky, open: star) | Spatial sky continuum emission | Spatial sky telluric CO2 absorption deviations (filled: H < 10) | |||||||||||||||||||||||
| 0 | 0 |
|
|
|
|
|
|
| IPAIR | NAME | SHIFT | NEWSHIFT | S/N | NAME | SHIFT | NEWSHIFT | S/N |
| 0 | 11140030 | 0.484204 | 0.00000 | 177.907 | 11140024 | 0.00000 | 0.484204 | 171.468 |
| 1 | 11140029 | 0.484067 | 0.000137001 | 177.909 | 11140031 | -0.000814315 | 0.485018 | 171.555 |
| 2 | 11140025 | 0.483010 | 0.00119400 | 169.379 | 11140027 | -0.00218461 | 0.486389 | 169.940 |
| 3 | 11140026 | 0.483212 | 0.000992000 | 167.695 | 11140028 | -0.00169035 | 0.485894 | 169.095 |