| Red | Green | Blue | |
| z | 17.64 | ||
| znorm | Inf | ||
| sky | -Inf | -Inf | -Inf |
| S/N | 21.8 | 39.5 | 41.1 |
| S/N(c) | 0.0 | 0.0 | 0.0 |
| SN(E/C) |
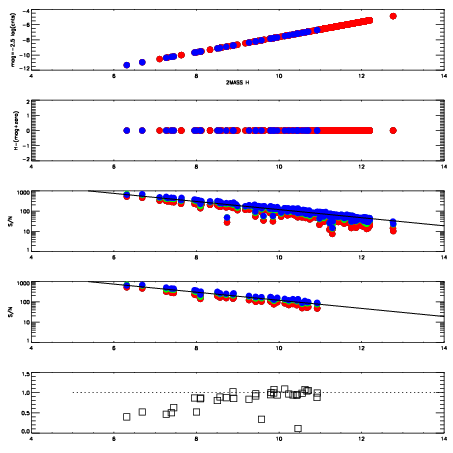
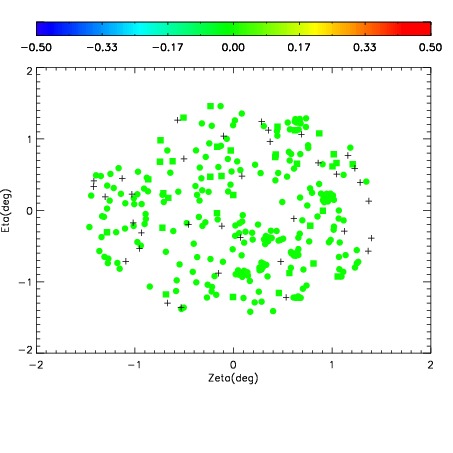
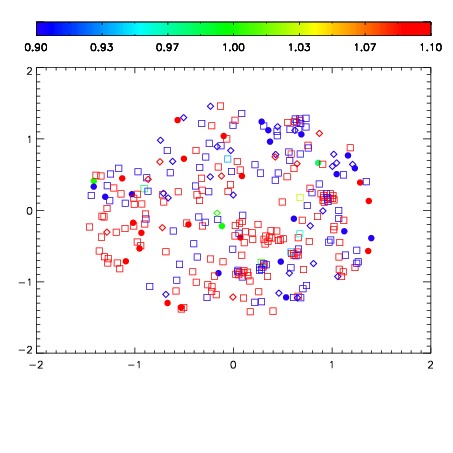
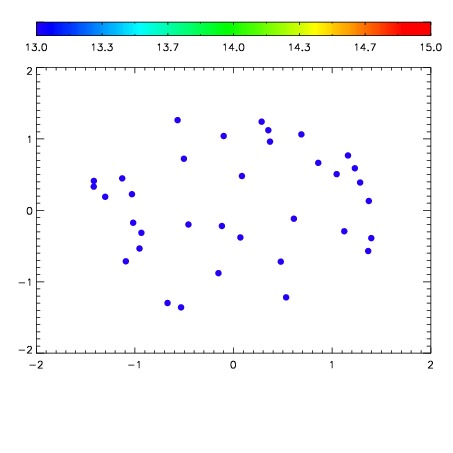

| Frame | Nreads | Zeropoints | Mag plots | Spatial mag deviation | Spatial sky 16325A emission deviations (filled: sky, open: star) | Spatial sky continuum emission | Spatial sky telluric CO2 absorption deviations (filled: H < 10) | |||||||||||||||||||||||
| 0 | 0 |
|
|
|
|
|
|
| IPAIR | NAME | SHIFT | NEWSHIFT | S/N | NAME | SHIFT | NEWSHIFT | S/N |
| 0 | 11640015 | 0.493106 | 0.00000 | 152.196 | 11640016 | -0.00160468 | 0.494711 | 157.514 |
| 1 | 11640018 | 0.491111 | 0.00199500 | 164.102 | 11640020 | -0.00130348 | 0.494410 | 165.142 |
| 2 | 11640019 | 0.491607 | 0.00149900 | 162.978 | 11640013 | 0.00000 | 0.493106 | 161.630 |
| 3 | 11640014 | 0.492686 | 0.000420004 | 153.360 | 11640017 | -0.00173518 | 0.494841 | 159.221 |