| Red | Green | Blue | |
| z | 17.64 | ||
| znorm | Inf | ||
| sky | -Inf | -Inf | -Inf |
| S/N | 26.7 | 45.9 | 49.3 |
| S/N(c) | 0.0 | 0.0 | 0.0 |
| SN(E/C) |
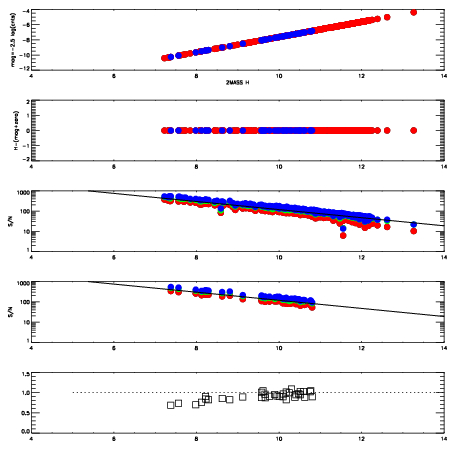
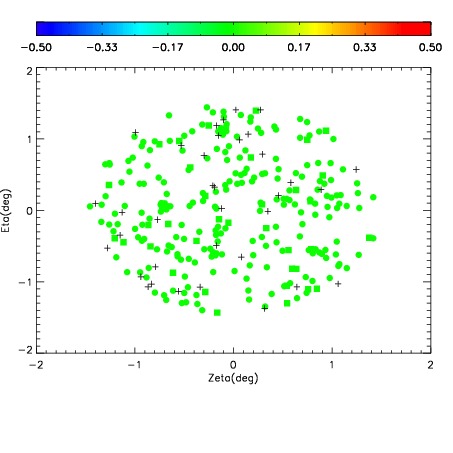
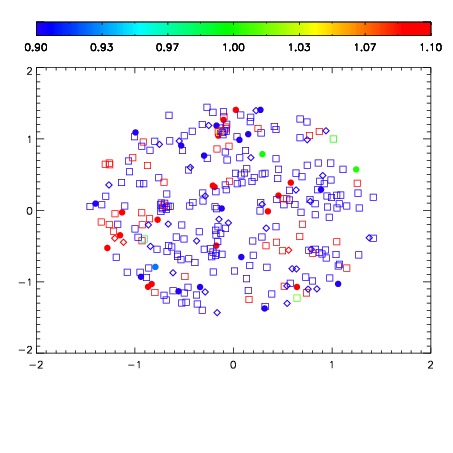
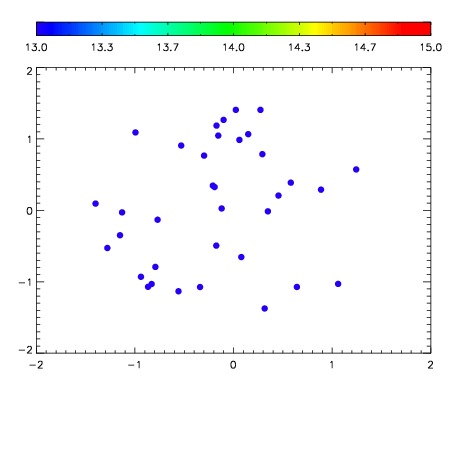

| Frame | Nreads | Zeropoints | Mag plots | Spatial mag deviation | Spatial sky 16325A emission deviations (filled: sky, open: star) | Spatial sky continuum emission | Spatial sky telluric CO2 absorption deviations (filled: H < 10) | |||||||||||||||||||||||
| 0 | 0 |
|
|
|
|
|
|
| IPAIR | NAME | SHIFT | NEWSHIFT | S/N | NAME | SHIFT | NEWSHIFT | S/N |
| 0 | 11100050 | 0.469955 | 0.00000 | 211.290 | 11100048 | 0.00000 | 0.469955 | 216.106 |
| 1 | 11100054 | 0.469730 | 0.000225008 | 221.281 | 11100052 | -0.00208683 | 0.472042 | 231.761 |
| 2 | 11100053 | 0.469632 | 0.000322998 | 216.363 | 11100051 | -0.00137402 | 0.471329 | 225.753 |
| 3 | 11100049 | 0.468835 | 0.00112000 | 213.441 | 11100055 | -0.00270223 | 0.472657 | 220.649 |