| Red | Green | Blue | |
| z | 17.64 | ||
| znorm | Inf | ||
| sky | -Inf | -Inf | -Inf |
| S/N | 25.4 | 44.7 | 48.0 |
| S/N(c) | 0.0 | 0.0 | 0.0 |
| SN(E/C) |
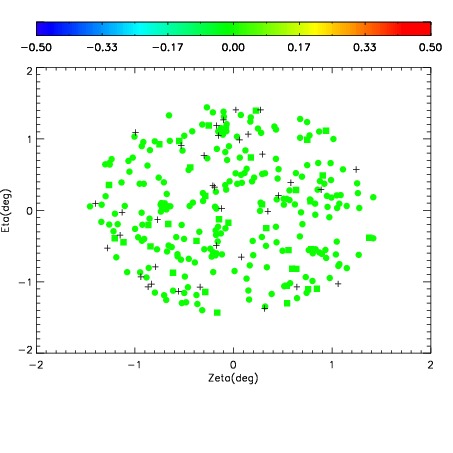
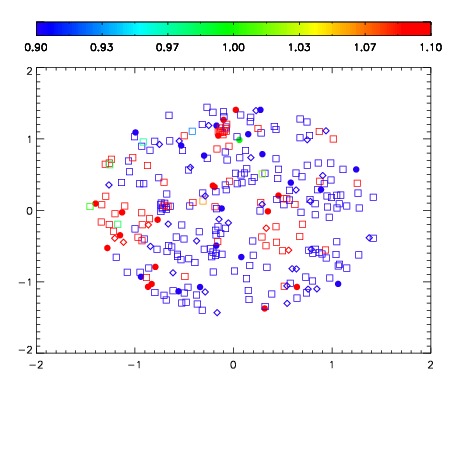
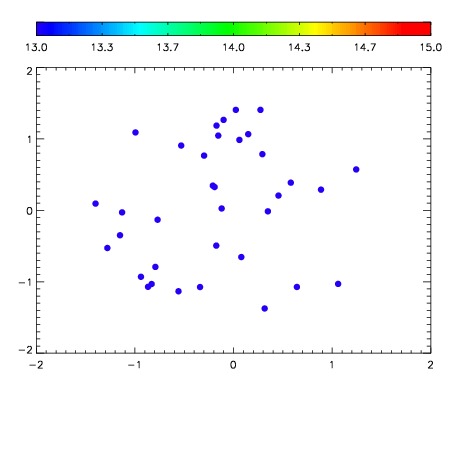

| Frame | Nreads | Zeropoints | Mag plots | Spatial mag deviation | Spatial sky 16325A emission deviations (filled: sky, open: star) | Spatial sky continuum emission | Spatial sky telluric CO2 absorption deviations (filled: H < 10) | |||||||||||||||||||||||
| 0 | 0 |
|
|
|
|
|
|
| IPAIR | NAME | SHIFT | NEWSHIFT | S/N | NAME | SHIFT | NEWSHIFT | S/N |
| 0 | 11140041 | 0.487291 | 0.00000 | 206.423 | 11140039 | -1.91913e-05 | 0.487310 | 219.418 |
| 1 | 11140040 | 0.486323 | 0.000968009 | 213.341 | 11140038 | 0.000172910 | 0.487118 | 221.820 |
| 2 | 11140037 | 0.485794 | 0.00149700 | 204.940 | 11140042 | 0.000491530 | 0.486799 | 209.745 |
| 3 | 11140036 | 0.485547 | 0.00174400 | 200.738 | 11140035 | 0.00000 | 0.487291 | 202.711 |