| Red | Green | Blue | |
| z | 17.64 | ||
| znorm | Inf | ||
| sky | -NaN | -Inf | -Inf |
| S/N | 8.7 | 19.2 | 19.2 |
| S/N(c) | 0.0 | 0.0 | 0.0 |
| SN(E/C) |
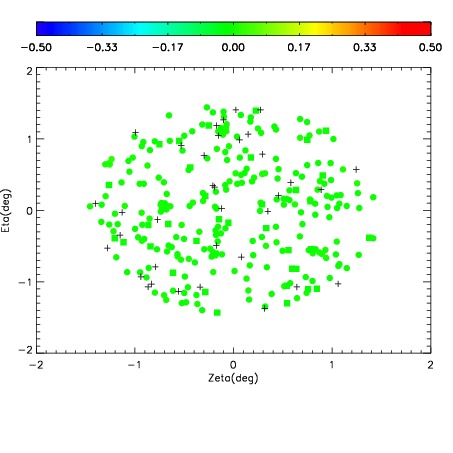
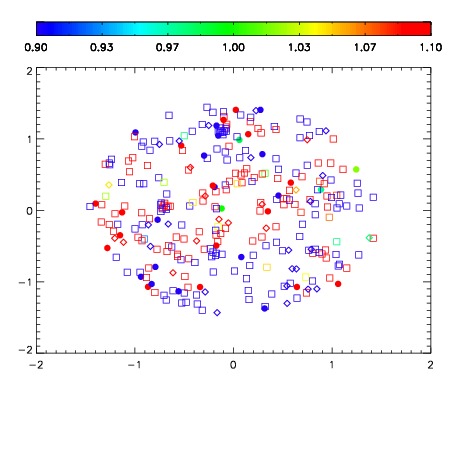
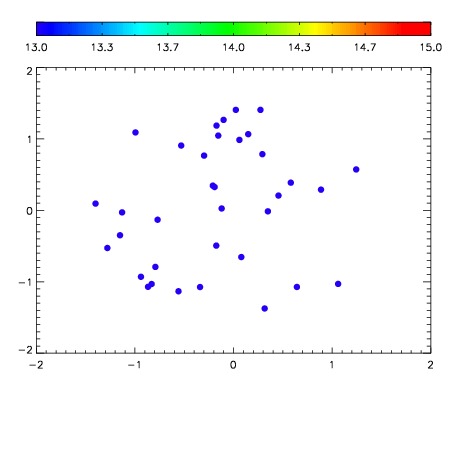

| Frame | Nreads | Zeropoints | Mag plots | Spatial mag deviation | Spatial sky 16325A emission deviations (filled: sky, open: star) | Spatial sky continuum emission | Spatial sky telluric CO2 absorption deviations (filled: H < 10) | |||||||||||||||||||||||
| 0 | 0 |
|
|
|
|
|
|
| IPAIR | NAME | SHIFT | NEWSHIFT | S/N | NAME | SHIFT | NEWSHIFT | S/N |
| 0 | 11160013 | 0.488035 | 0.00000 | 110.109 | 11160014 | -0.00230347 | 0.490338 | 106.879 |
| 1 | 11160016 | 0.483865 | 0.00417000 | 118.934 | 11160015 | -0.00215814 | 0.490193 | 116.743 |
| 2 | 11160017 | 0.484524 | 0.00351098 | 118.628 | 11160018 | -0.00152709 | 0.489562 | 109.875 |
| 3 | 11160012 | 0.487170 | 0.000864983 | 96.6017 | 11160011 | 0.00000 | 0.488035 | 87.3655 |