| Red | Green | Blue | |
| z | 17.64 | ||
| znorm | Inf | ||
| sky | -Inf | -Inf | -Inf |
| S/N | 21.1 | 38.3 | 40.9 |
| S/N(c) | 0.0 | 0.0 | 0.0 |
| SN(E/C) |
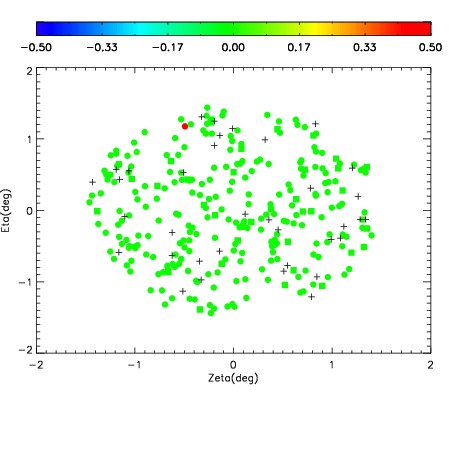
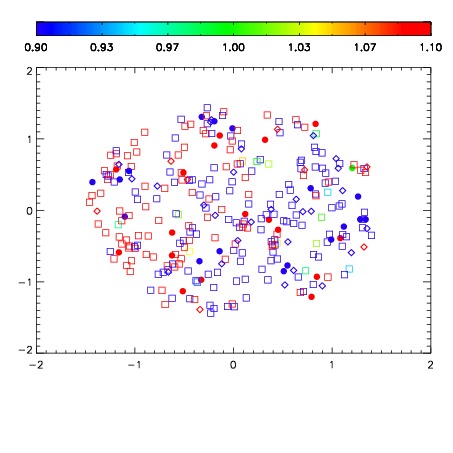
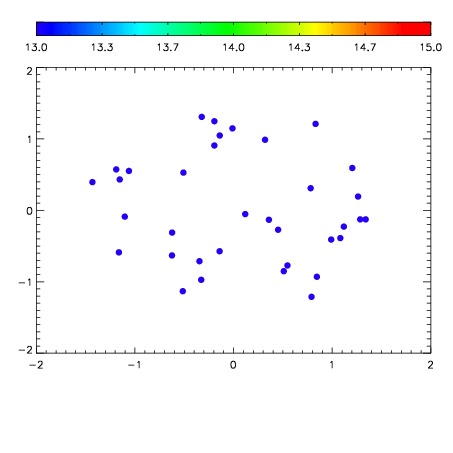

| Frame | Nreads | Zeropoints | Mag plots | Spatial mag deviation | Spatial sky 16325A emission deviations (filled: sky, open: star) | Spatial sky continuum emission | Spatial sky telluric CO2 absorption deviations (filled: H < 10) | |||||||||||||||||||||||
| 0 | 0 |
|
|
|
|
|
|
| IPAIR | NAME | SHIFT | NEWSHIFT | S/N | NAME | SHIFT | NEWSHIFT | S/N |
| 0 | 11450013 | 0.474820 | 0.00000 | 151.115 | 11450015 | -0.00207687 | 0.476897 | 148.383 |
| 1 | 11450012 | 0.473402 | 0.00141799 | 157.397 | 11450011 | 0.00000 | 0.474820 | 160.089 |
| 2 | 11450016 | 0.473755 | 0.00106499 | 133.024 | 11450014 | -0.00177309 | 0.476593 | 147.937 |
| 3 | 11450017 | 0.474415 | 0.000404984 | 129.504 | 11450018 | -0.00315626 | 0.477976 | 126.310 |