| Red | Green | Blue | |
| z | 17.64 | ||
| znorm | Inf | ||
| sky | -Inf | -Inf | -Inf |
| S/N | 30.8 | 49.2 | 54.0 |
| S/N(c) | 0.0 | 0.0 | 0.0 |
| SN(E/C) |
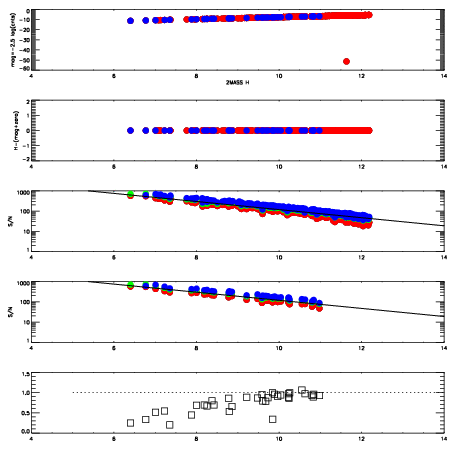
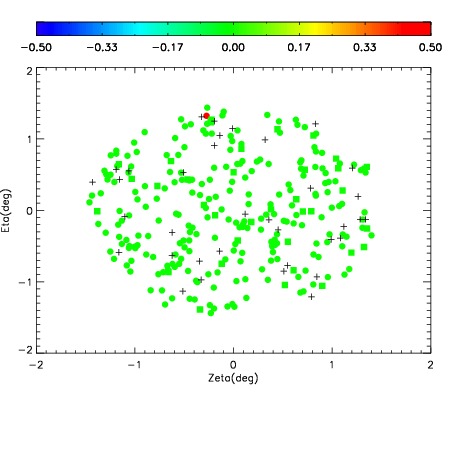
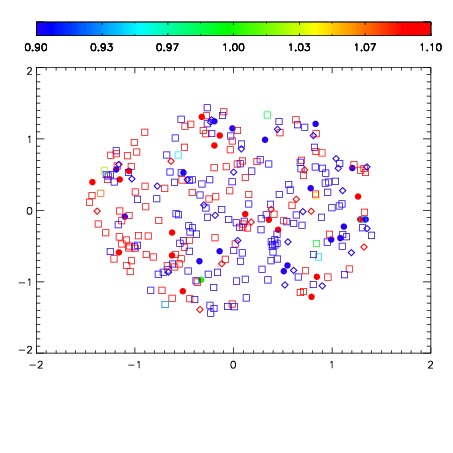
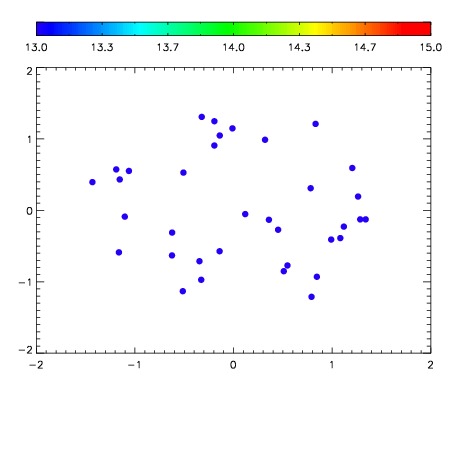

| Frame | Nreads | Zeropoints | Mag plots | Spatial mag deviation | Spatial sky 16325A emission deviations (filled: sky, open: star) | Spatial sky continuum emission | Spatial sky telluric CO2 absorption deviations (filled: H < 10) | |||||||||||||||||||||||
| 0 | 0 |
|
|
|
|
|
|
| IPAIR | NAME | SHIFT | NEWSHIFT | S/N | NAME | SHIFT | NEWSHIFT | S/N |
| 0 | 11650013 | 0.495409 | 0.00000 | 188.109 | 11650014 | -0.00131350 | 0.496723 | 189.142 |
| 1 | 11650016 | 0.492204 | 0.00320500 | 194.647 | 11650018 | -0.00208528 | 0.497494 | 195.223 |
| 2 | 11650017 | 0.493178 | 0.00223100 | 194.547 | 11650015 | -0.000996523 | 0.496406 | 193.275 |
| 3 | 11650012 | 0.495381 | 2.80142e-05 | 184.726 | 11650011 | 0.00000 | 0.495409 | 179.799 |