| Red | Green | Blue | |
| z | 17.64 | ||
| znorm | Inf | ||
| sky | -Inf | -Inf | -Inf |
| S/N | 24.0 | 40.7 | 45.0 |
| S/N(c) | 0.0 | 0.0 | 0.0 |
| SN(E/C) |
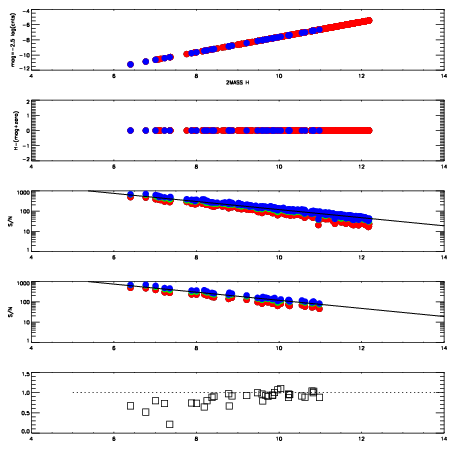


| Frame | Nreads | Zeropoints | Mag plots | Spatial mag deviation | Spatial sky 16325A emission deviations (filled: sky, open: star) | Spatial sky continuum emission | Spatial sky telluric CO2 absorption deviations (filled: H < 10) | |||||||||||||||||||||||
| 0 | 0 |
|
|
|
|
|
|
| IPAIR | NAME | SHIFT | NEWSHIFT | S/N | NAME | SHIFT | NEWSHIFT | S/N |
| 0 | 11710013 | 0.487746 | 0.00000 | 171.850 | 11710015 | -0.00247913 | 0.490225 | 172.108 |
| 1 | 11710016 | 0.487533 | 0.000212997 | 172.075 | 11710014 | -0.00255317 | 0.490299 | 176.581 |
| 2 | 11710012 | 0.487155 | 0.000591010 | 165.082 | 11710011 | 0.00000 | 0.487746 | 167.089 |
| 3 | 11710017 | 0.487225 | 0.000521004 | 163.590 | 11710018 | -0.00393223 | 0.491678 | 163.615 |