| Red | Green | Blue | |
| z | 17.64 | ||
| znorm | Inf | ||
| sky | -Inf | -Inf | -Inf |
| S/N | 20.5 | 37.0 | 37.1 |
| S/N(c) | 0.0 | 0.0 | 0.0 |
| SN(E/C) |
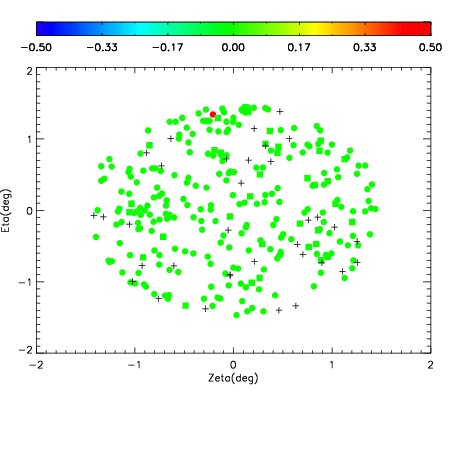
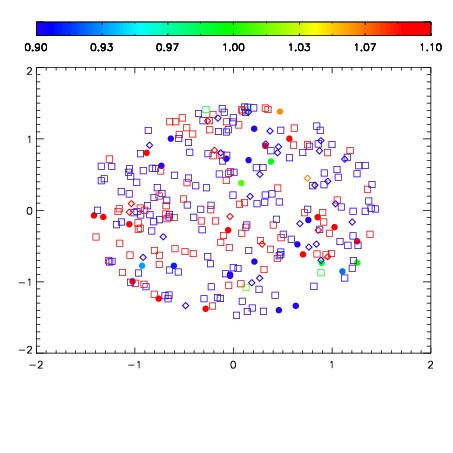
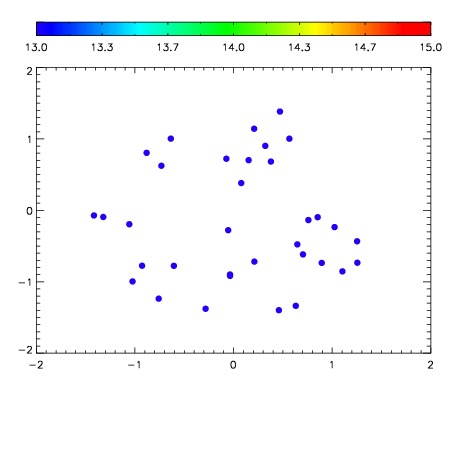

| Frame | Nreads | Zeropoints | Mag plots | Spatial mag deviation | Spatial sky 16325A emission deviations (filled: sky, open: star) | Spatial sky continuum emission | Spatial sky telluric CO2 absorption deviations (filled: H < 10) | |||||||||||||||||||||||
| 0 | 0 |
|
|
|
|
|
|
| IPAIR | NAME | SHIFT | NEWSHIFT | S/N | NAME | SHIFT | NEWSHIFT | S/N |
| 0 | 11170046 | 0.475149 | 0.00000 | 164.541 | 11170052 | -0.00632317 | 0.481472 | 164.241 |
| 1 | 11170047 | 0.474379 | 0.000770003 | 173.422 | 11170048 | -0.00553480 | 0.480684 | 168.554 |
| 2 | 11170050 | 0.473787 | 0.00136200 | 158.175 | 11170045 | 0.00000 | 0.475149 | 161.292 |
| 3 | 11170051 | 0.472781 | 0.00236800 | 156.875 | 11170049 | -0.00472651 | 0.479876 | 154.983 |