| Red | Green | Blue | |
| z | 17.64 | ||
| znorm | Inf | ||
| sky | -Inf | -Inf | -Inf |
| S/N | 23.7 | 39.4 | 42.9 |
| S/N(c) | 0.0 | 0.0 | 0.0 |
| SN(E/C) |
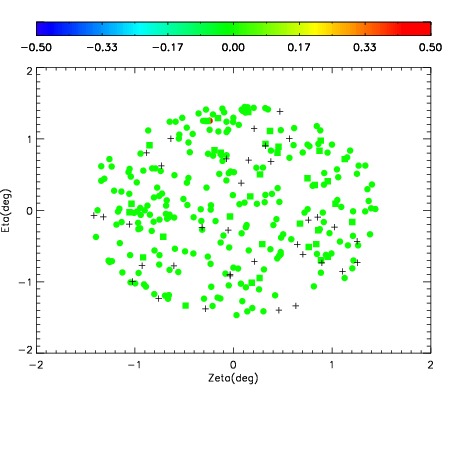

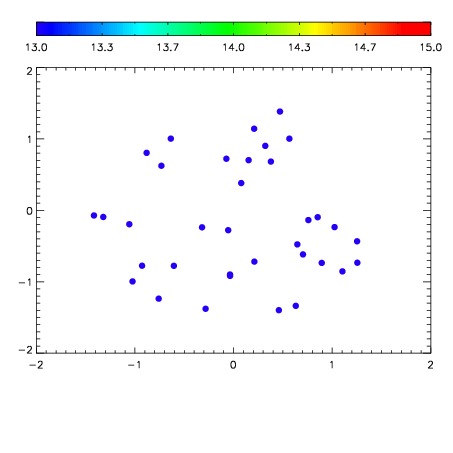

| Frame | Nreads | Zeropoints | Mag plots | Spatial mag deviation | Spatial sky 16325A emission deviations (filled: sky, open: star) | Spatial sky continuum emission | Spatial sky telluric CO2 absorption deviations (filled: H < 10) | |||||||||||||||||||||||
| 0 | 0 |
|
|
|
|
|
|
| IPAIR | NAME | SHIFT | NEWSHIFT | S/N | NAME | SHIFT | NEWSHIFT | S/N |
| 0 | 11390024 | 0.471876 | 0.00000 | 180.786 | 11390025 | -0.000334923 | 0.472211 | 199.391 |
| 1 | 11390027 | 0.470721 | 0.00115499 | 215.981 | 11390026 | -1.33400e-06 | 0.471877 | 211.546 |
| 2 | 11390028 | 0.471421 | 0.000454992 | 202.243 | 11390029 | 0.00184186 | 0.470034 | 206.003 |
| 3 | 11390023 | 0.471823 | 5.29885e-05 | 184.755 | 11390022 | 0.00000 | 0.471876 | 202.578 |