| Red | Green | Blue | |
| z | 17.64 | ||
| znorm | Inf | ||
| sky | -Inf | -Inf | -Inf |
| S/N | 21.3 | 35.9 | 37.1 |
| S/N(c) | 0.0 | 0.0 | 0.0 |
| SN(E/C) |

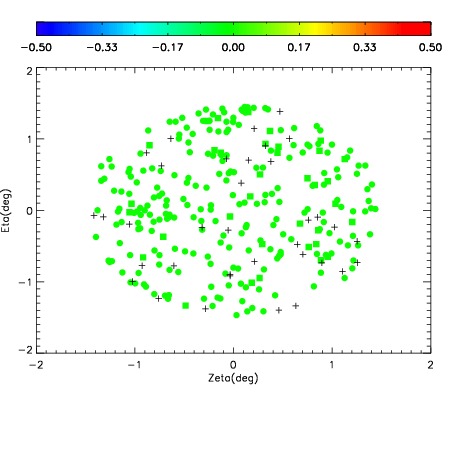
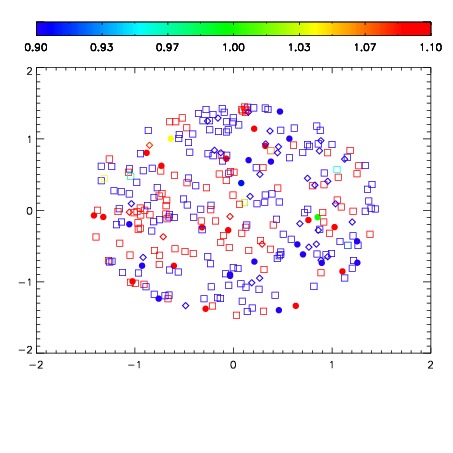

| Frame | Nreads | Zeropoints | Mag plots | Spatial mag deviation | Spatial sky 16325A emission deviations (filled: sky, open: star) | Spatial sky continuum emission | Spatial sky telluric CO2 absorption deviations (filled: H < 10) | |||||||||||||||||||||||
| 0 | 0 |
|
|
|
|
|
|
| IPAIR | NAME | SHIFT | NEWSHIFT | S/N | NAME | SHIFT | NEWSHIFT | S/N |
| 0 | 11410024 | 0.474457 | 0.00000 | 189.174 | 11410026 | -0.00156624 | 0.476023 | 139.873 |
| 1 | 11410023 | 0.473403 | 0.00105399 | 204.049 | 11410022 | 0.00000 | 0.474457 | 178.754 |
| 2 | 11410028 | 0.474299 | 0.000157982 | 192.528 | 11410029 | -0.00111024 | 0.475567 | 174.209 |
| 3 | 11410027 | 0.473759 | 0.000698000 | 178.681 | 11410025 | -0.00186821 | 0.476325 | 114.934 |