| Red | Green | Blue | |
| z | 17.64 | ||
| znorm | Inf | ||
| sky | -Inf | -NaN | -Inf |
| S/N | 26.6 | 46.3 | 52.0 |
| S/N(c) | 0.0 | 0.0 | 0.0 |
| SN(E/C) |
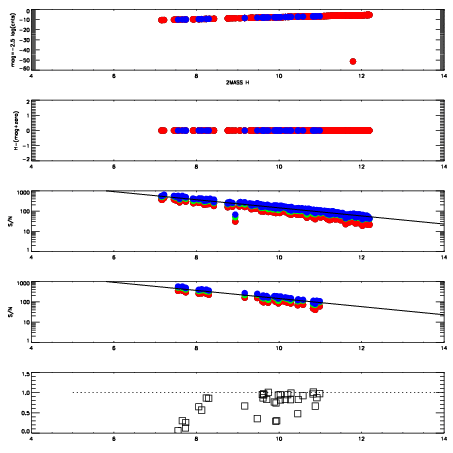
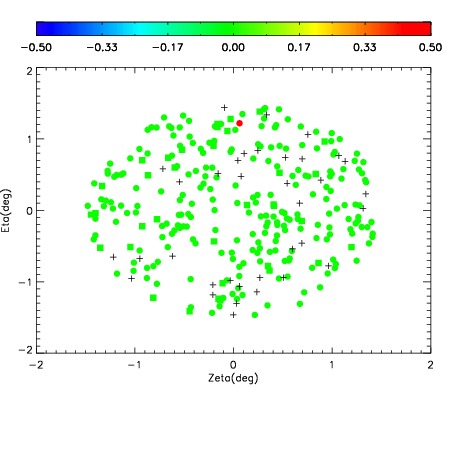
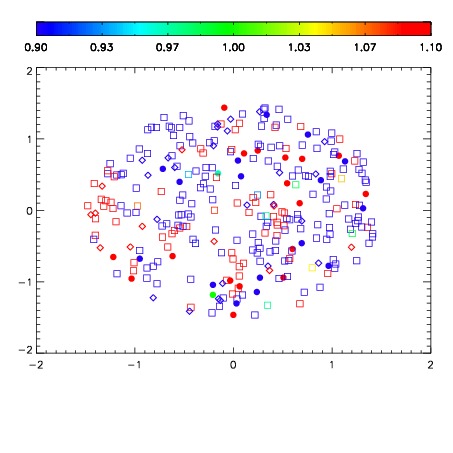
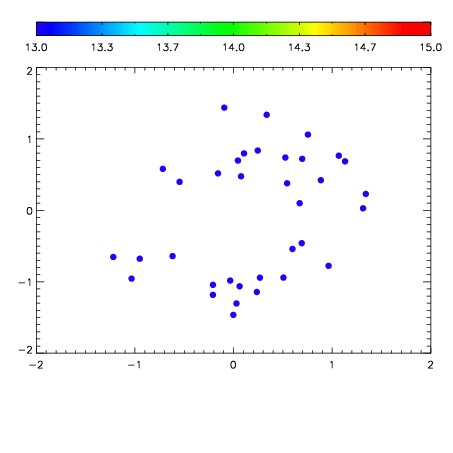

| Frame | Nreads | Zeropoints | Mag plots | Spatial mag deviation | Spatial sky 16325A emission deviations (filled: sky, open: star) | Spatial sky continuum emission | Spatial sky telluric CO2 absorption deviations (filled: H < 10) | |||||||||||||||||||||||
| 0 | 0 |
|
|
|
|
|
|
| IPAIR | NAME | SHIFT | NEWSHIFT | S/N | NAME | SHIFT | NEWSHIFT | S/N |
| 0 | 11060031 | 0.480800 | 0.00000 | 187.795 | 11060029 | -0.000755658 | 0.481556 | 186.731 |
| 1 | 11060027 | 0.478405 | 0.00239500 | 198.024 | 11060037 | -0.00422718 | 0.485027 | 202.465 |
| 2 | 11060032 | 0.480698 | 0.000102013 | 193.911 | 11060026 | 0.00000 | 0.480800 | 197.165 |
| 3 | 11060028 | 0.479903 | 0.000896990 | 189.216 | 11060033 | -0.00551841 | 0.486318 | 195.380 |
| 4 | 11060036 | 0.478158 | 0.00264201 | 188.602 | 11060034 | -0.00558531 | 0.486385 | 194.690 |
| 5 | 11060035 | 0.478111 | 0.00268900 | 188.384 | 11060030 | -0.000970746 | 0.481771 | 193.558 |