| Red | Green | Blue | |
| z | 17.64 | ||
| znorm | Inf | ||
| sky | -Inf | -Inf | -Inf |
| S/N | 27.8 | 47.9 | 50.3 |
| S/N(c) | 0.0 | 0.0 | 0.0 |
| SN(E/C) |
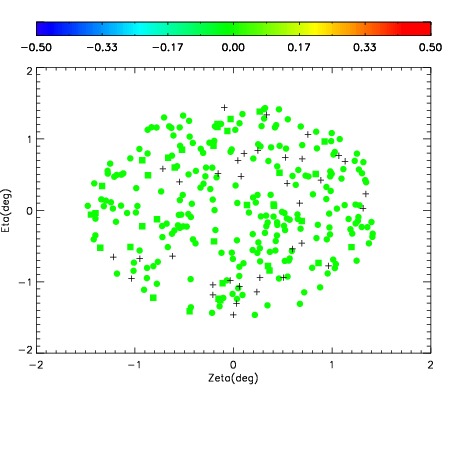
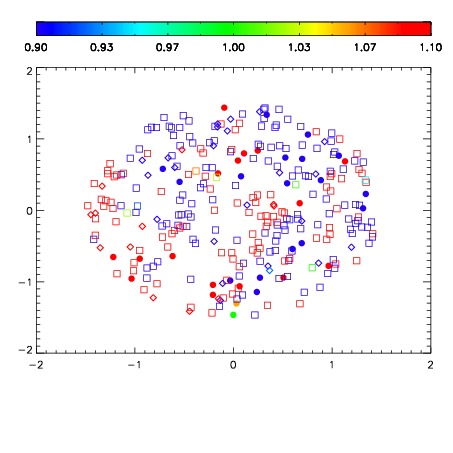
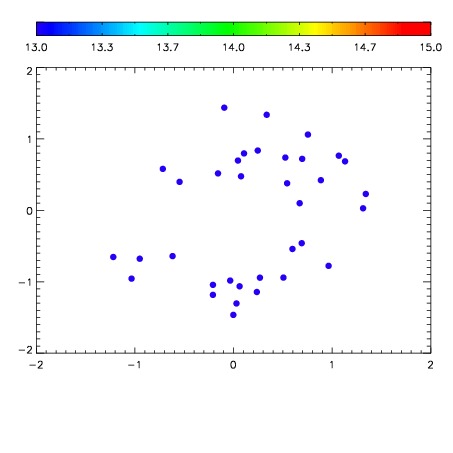

| Frame | Nreads | Zeropoints | Mag plots | Spatial mag deviation | Spatial sky 16325A emission deviations (filled: sky, open: star) | Spatial sky continuum emission | Spatial sky telluric CO2 absorption deviations (filled: H < 10) | |||||||||||||||||||||||
| 0 | 0 |
|
|
|
|
|
|
| IPAIR | NAME | SHIFT | NEWSHIFT | S/N | NAME | SHIFT | NEWSHIFT | S/N |
| 0 | 11360017 | 0.482073 | 0.00000 | 223.090 | 11360018 | -0.000790913 | 0.482864 | 222.663 |
| 1 | 11360016 | 0.481827 | 0.000246018 | 223.202 | 11360011 | 0.00000 | 0.482073 | 224.855 |
| 2 | 11360012 | 0.481010 | 0.00106302 | 219.841 | 11360015 | -0.000795984 | 0.482869 | 220.145 |
| 3 | 11360013 | 0.480915 | 0.00115800 | 218.960 | 11360014 | -0.000450147 | 0.482523 | 215.246 |