| Red | Green | Blue | |
| z | 17.64 | ||
| znorm | Inf | ||
| sky | -Inf | -Inf | -Inf |
| S/N | 24.4 | 41.4 | 44.5 |
| S/N(c) | 0.0 | 0.0 | 0.0 |
| SN(E/C) |
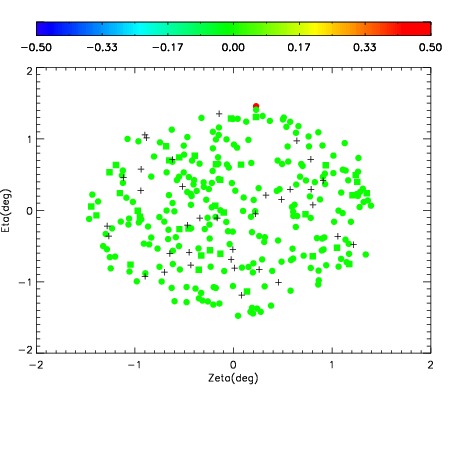
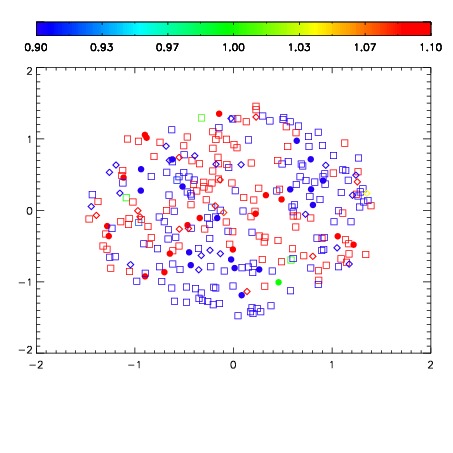
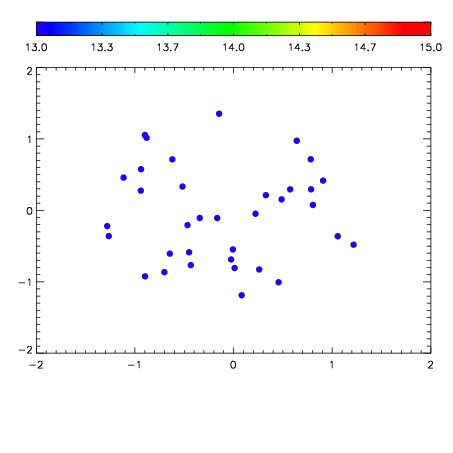

| Frame | Nreads | Zeropoints | Mag plots | Spatial mag deviation | Spatial sky 16325A emission deviations (filled: sky, open: star) | Spatial sky continuum emission | Spatial sky telluric CO2 absorption deviations (filled: H < 10) | |||||||||||||||||||||||
| 0 | 0 |
|
|
|
|
|
|
| IPAIR | NAME | SHIFT | NEWSHIFT | S/N | NAME | SHIFT | NEWSHIFT | S/N |
| 0 | 11090028 | 0.478291 | 0.00000 | 185.585 | 11090030 | -0.00287721 | 0.481168 | 187.550 |
| 1 | 11090025 | 0.478205 | 8.60095e-05 | 187.915 | 11090026 | -0.00178543 | 0.480076 | 191.861 |
| 2 | 11090029 | 0.478007 | 0.000284016 | 184.222 | 11090023 | 0.00000 | 0.478291 | 183.439 |
| 3 | 11090024 | 0.477849 | 0.000441998 | 180.060 | 11090027 | -0.00131858 | 0.479610 | 177.547 |