| Red | Green | Blue | |
| z | 17.64 | ||
| znorm | Inf | ||
| sky | -NaN | -NaN | -Inf |
| S/N | 28.5 | 48.1 | 54.0 |
| S/N(c) | 0.0 | 0.0 | 0.0 |
| SN(E/C) |
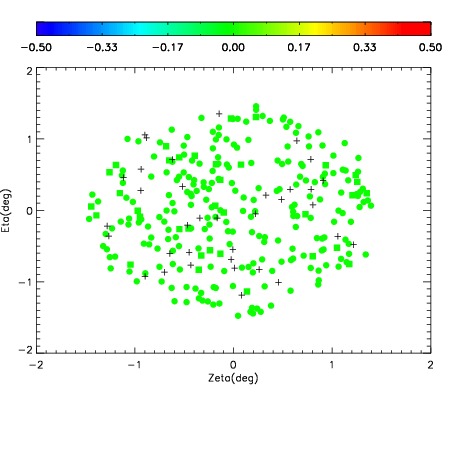
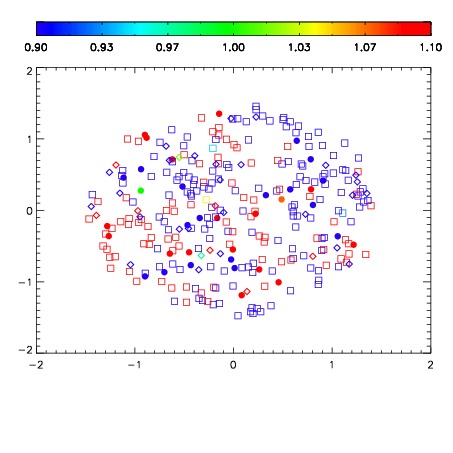
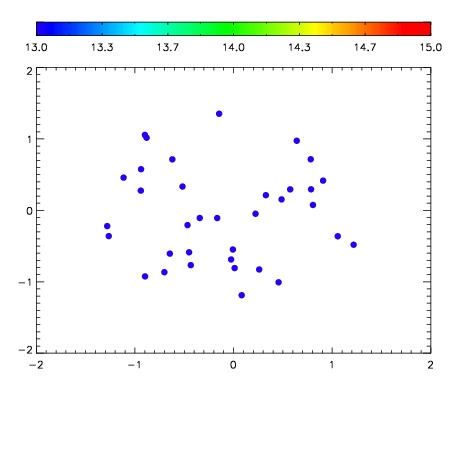

| Frame | Nreads | Zeropoints | Mag plots | Spatial mag deviation | Spatial sky 16325A emission deviations (filled: sky, open: star) | Spatial sky continuum emission | Spatial sky telluric CO2 absorption deviations (filled: H < 10) | |||||||||||||||||||||||
| 0 | 0 |
|
|
|
|
|
|
| IPAIR | NAME | SHIFT | NEWSHIFT | S/N | NAME | SHIFT | NEWSHIFT | S/N |
| 0 | 11130028 | 0.481238 | 0.00000 | 196.857 | 11130029 | -0.00283405 | 0.484072 | 193.546 |
| 1 | 11130027 | 0.481177 | 6.10054e-05 | 194.350 | 11130026 | -0.00274097 | 0.483979 | 193.101 |
| 2 | 11130024 | 0.481212 | 2.60174e-05 | 190.616 | 11130025 | -0.00298546 | 0.484223 | 192.628 |
| 3 | 11130023 | 0.480366 | 0.000872016 | 185.250 | 11130022 | 0.00000 | 0.481238 | 181.963 |