| Red | Green | Blue | |
| z | 17.64 | ||
| znorm | Inf | ||
| sky | -Inf | -Inf | -Inf |
| S/N | 22.3 | 38.8 | 42.7 |
| S/N(c) | 0.0 | 0.0 | 0.0 |
| SN(E/C) |

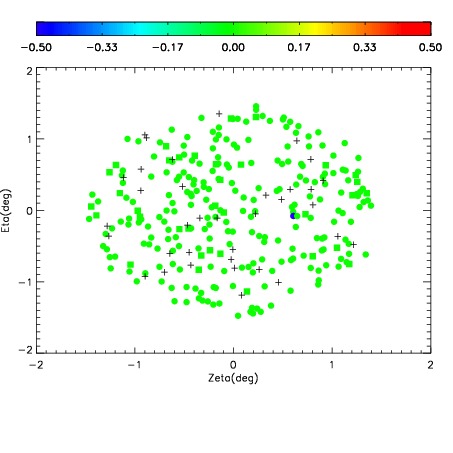
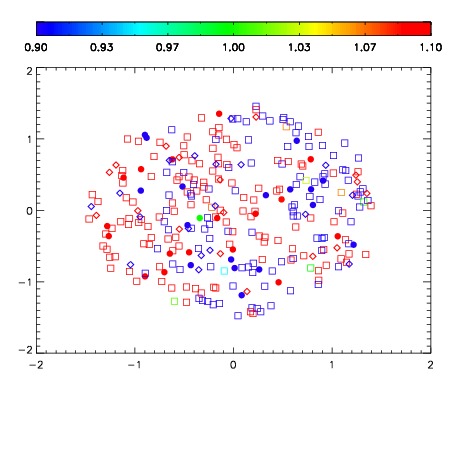
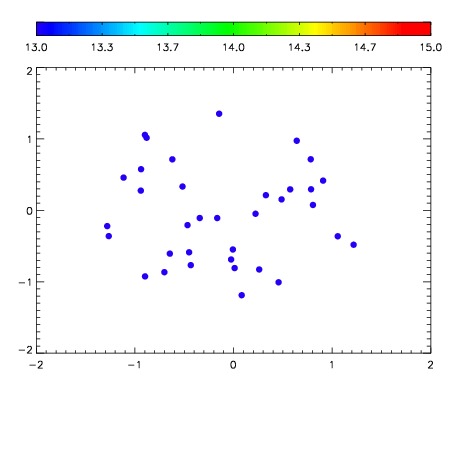

| Frame | Nreads | Zeropoints | Mag plots | Spatial mag deviation | Spatial sky 16325A emission deviations (filled: sky, open: star) | Spatial sky continuum emission | Spatial sky telluric CO2 absorption deviations (filled: H < 10) | |||||||||||||||||||||||
| 0 | 0 |
|
|
|
|
|
|
| IPAIR | NAME | SHIFT | NEWSHIFT | S/N | NAME | SHIFT | NEWSHIFT | S/N |
| 0 | 11420012 | 0.479127 | 0.00000 | 189.747 | 11420011 | 0.00000 | 0.479127 | 190.152 |
| 1 | 11420013 | 0.479096 | 3.09944e-05 | 182.815 | 11420014 | -0.000971235 | 0.480098 | 176.493 |
| 2 | 11420017 | 0.478472 | 0.000654995 | 155.357 | 11420015 | -0.000588583 | 0.479716 | 159.720 |
| 3 | 11420016 | 0.478414 | 0.000712991 | 153.156 | 11420018 | -0.00114456 | 0.480272 | 146.446 |