| Red | Green | Blue | |
| z | 17.64 | ||
| znorm | Inf | ||
| sky | -Inf | -Inf | -Inf |
| S/N | 30.5 | 50.1 | 55.8 |
| S/N(c) | 0.0 | 0.0 | 0.0 |
| SN(E/C) |
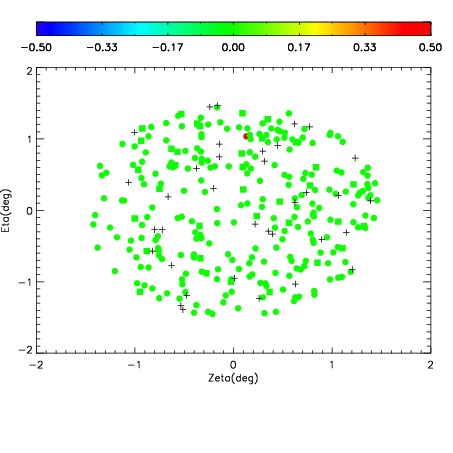
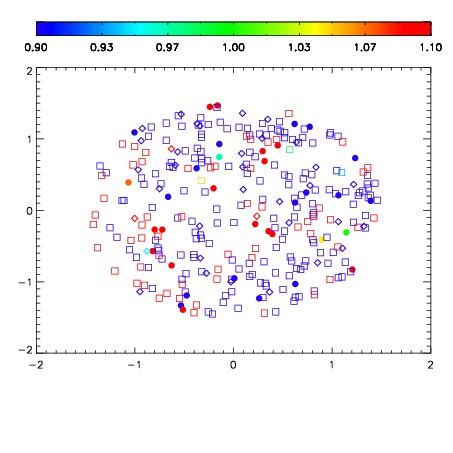
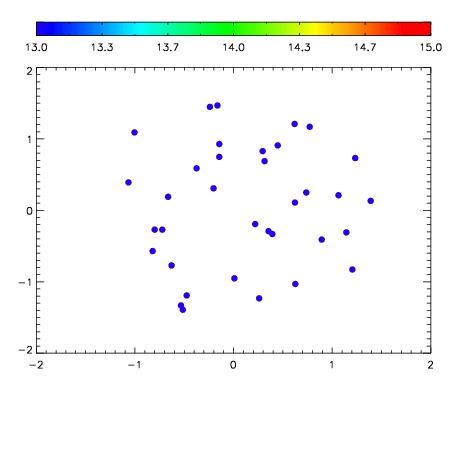

| Frame | Nreads | Zeropoints | Mag plots | Spatial mag deviation | Spatial sky 16325A emission deviations (filled: sky, open: star) | Spatial sky continuum emission | Spatial sky telluric CO2 absorption deviations (filled: H < 10) | |||||||||||||||||||||||
| 0 | 0 |
|
|
|
|
|
|
| IPAIR | NAME | SHIFT | NEWSHIFT | S/N | NAME | SHIFT | NEWSHIFT | S/N |
| 0 | 10880049 | 0.497928 | 0.00000 | 230.479 | 10880050 | -0.00372193 | 0.501650 | 231.367 |
| 1 | 10880053 | 0.497188 | 0.000739992 | 231.459 | 10880054 | 0.0994956 | 0.398432 | 232.044 |
| 2 | 10880052 | 0.497017 | 0.000910997 | 229.021 | 10880051 | -0.00386435 | 0.501792 | 227.797 |
| 3 | 10880048 | 0.496356 | 0.00157198 | 228.851 | 10880047 | 0.00000 | 0.497928 | 224.005 |