| Red | Green | Blue | |
| z | 17.64 | ||
| znorm | Inf | ||
| sky | -Inf | -Inf | -Inf |
| S/N | 26.9 | 45.7 | 51.3 |
| S/N(c) | 0.0 | 0.0 | 0.0 |
| SN(E/C) |
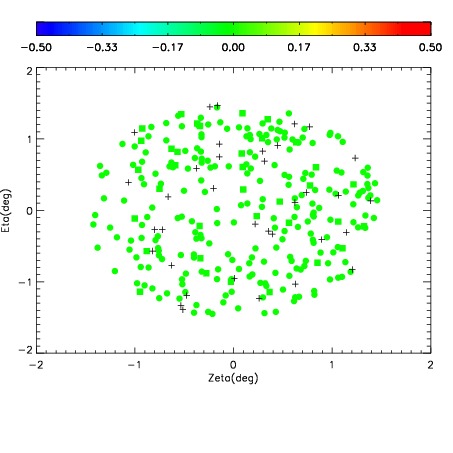
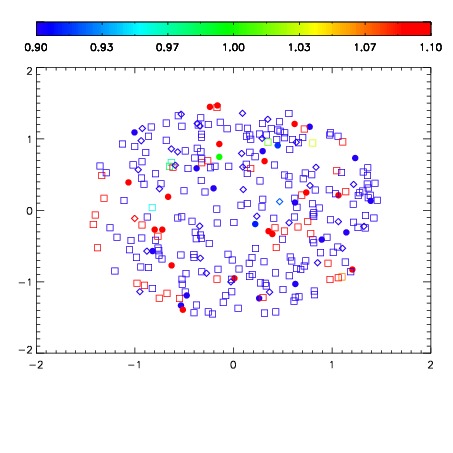
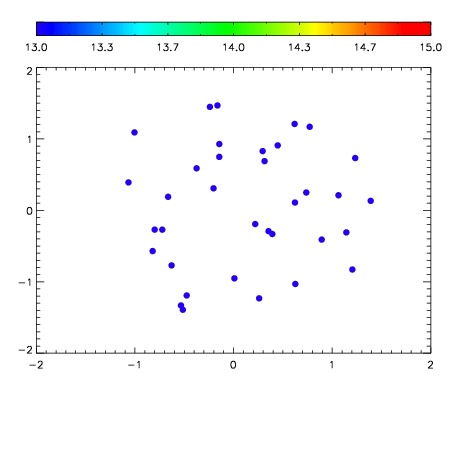

| Frame | Nreads | Zeropoints | Mag plots | Spatial mag deviation | Spatial sky 16325A emission deviations (filled: sky, open: star) | Spatial sky continuum emission | Spatial sky telluric CO2 absorption deviations (filled: H < 10) | |||||||||||||||||||||||
| 0 | 0 |
|
|
|
|
|
|
| IPAIR | NAME | SHIFT | NEWSHIFT | S/N | NAME | SHIFT | NEWSHIFT | S/N |
| 0 | 11110034 | 0.473892 | 0.00000 | 191.758 | 11110037 | -0.00605874 | 0.479951 | 181.881 |
| 1 | 11110039 | 0.471943 | 0.00194901 | 200.714 | 11110040 | -0.00609115 | 0.479983 | 199.455 |
| 2 | 11110038 | 0.472214 | 0.00167799 | 198.194 | 11110033 | 0.00000 | 0.473892 | 186.995 |
| 3 | 11110035 | 0.473792 | 0.000100017 | 191.773 | 11110036 | -0.00658549 | 0.480477 | 185.990 |