| Red | Green | Blue | |
| z | 17.64 | ||
| znorm | Inf | ||
| sky | -Inf | -Inf | -Inf |
| S/N | 26.4 | 45.4 | 48.9 |
| S/N(c) | 0.0 | 0.0 | 0.0 |
| SN(E/C) |
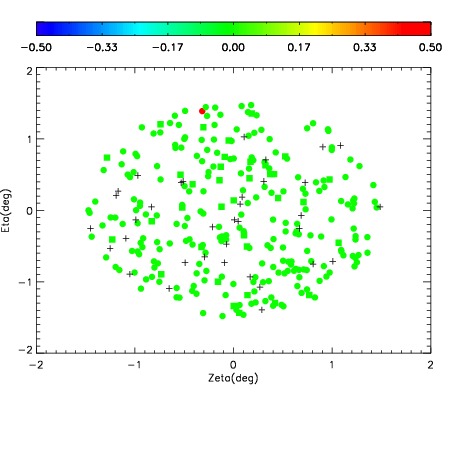
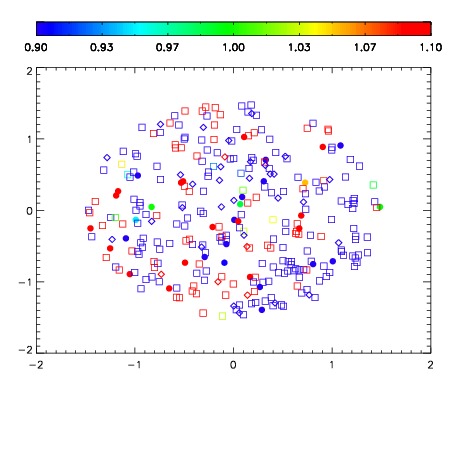
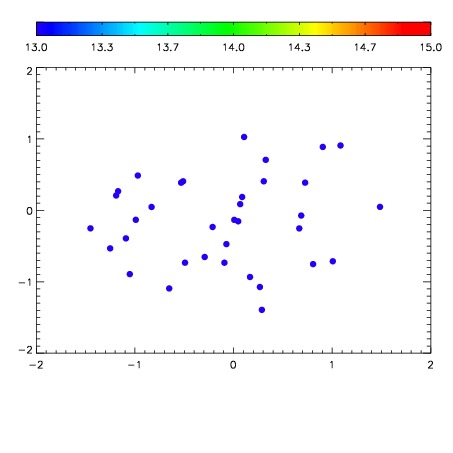

| Frame | Nreads | Zeropoints | Mag plots | Spatial mag deviation | Spatial sky 16325A emission deviations (filled: sky, open: star) | Spatial sky continuum emission | Spatial sky telluric CO2 absorption deviations (filled: H < 10) | |||||||||||||||||||||||
| 0 | 0 |
|
|
|
|
|
|
| IPAIR | NAME | SHIFT | NEWSHIFT | S/N | NAME | SHIFT | NEWSHIFT | S/N |
| 0 | 10270070 | 0.499602 | 0.00000 | 184.917 | 10270068 | 0.00000 | 0.499602 | 188.529 |
| 1 | 10270069 | 0.499133 | 0.000468999 | 189.731 | 10270075 | 0.00233231 | 0.497270 | 191.232 |
| 2 | 10270074 | 0.496732 | 0.00286999 | 187.570 | 10270071 | 0.00268837 | 0.496914 | 190.441 |
| 3 | 10270073 | 0.496709 | 0.00289300 | 186.288 | 10270072 | 0.00276334 | 0.496839 | 190.074 |