| Red | Green | Blue | |
| z | 17.64 | ||
| znorm | Inf | ||
| sky | -Inf | -Inf | -Inf |
| S/N | 32.4 | 53.5 | 57.9 |
| S/N(c) | 0.0 | 0.0 | 0.0 |
| SN(E/C) |
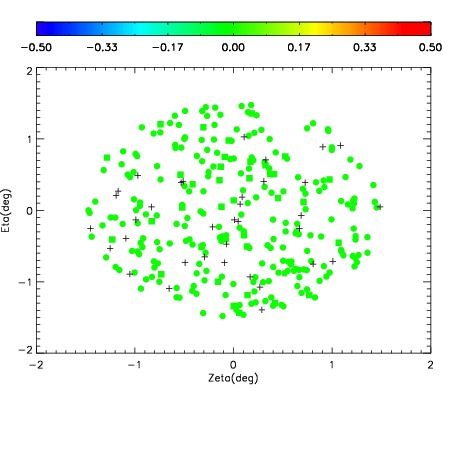
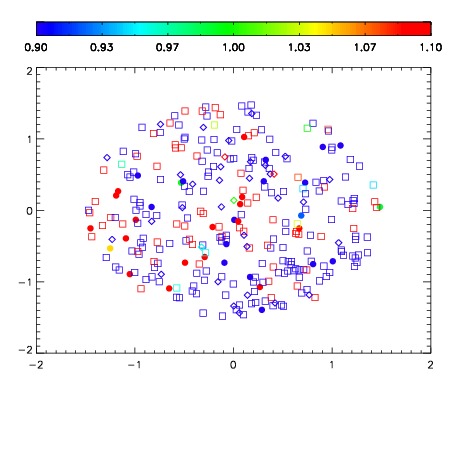
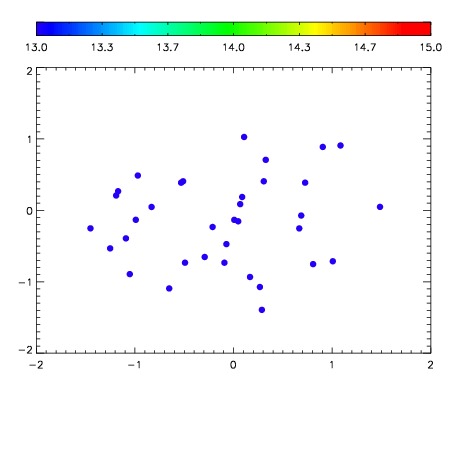

| Frame | Nreads | Zeropoints | Mag plots | Spatial mag deviation | Spatial sky 16325A emission deviations (filled: sky, open: star) | Spatial sky continuum emission | Spatial sky telluric CO2 absorption deviations (filled: H < 10) | |||||||||||||||||||||||
| 0 | 0 |
|
|
|
|
|
|
| IPAIR | NAME | SHIFT | NEWSHIFT | S/N | NAME | SHIFT | NEWSHIFT | S/N |
| 0 | 10310037 | 0.507451 | 0.00000 | 228.062 | 10310035 | 0.00387397 | 0.503577 | 224.887 |
| 1 | 10310032 | 0.505186 | 0.00226498 | 225.171 | 10310034 | 0.00342734 | 0.504024 | 224.547 |
| 2 | 10310036 | 0.507016 | 0.000434995 | 224.752 | 10310039 | 0.00128914 | 0.506162 | 221.773 |
| 3 | 10310040 | 0.506453 | 0.000998020 | 222.095 | 10310038 | 0.000462389 | 0.506989 | 221.020 |
| 4 | 10310033 | 0.506005 | 0.00144601 | 219.250 | 10310031 | 0.00000 | 0.507451 | 217.737 |