| Red | Green | Blue | |
| z | 17.64 | ||
| znorm | Inf | ||
| sky | -Inf | -Inf | -Inf |
| S/N | 17.1 | 27.5 | 31.6 |
| S/N(c) | 0.0 | 0.0 | 0.0 |
| SN(E/C) |
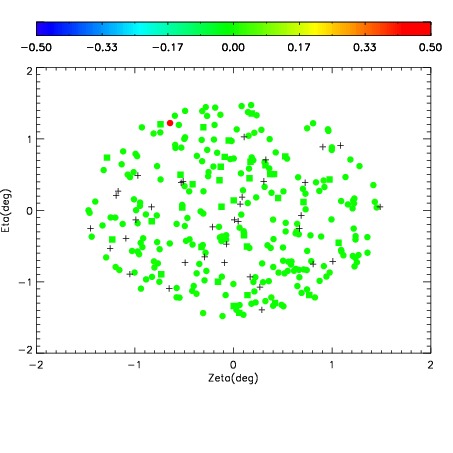
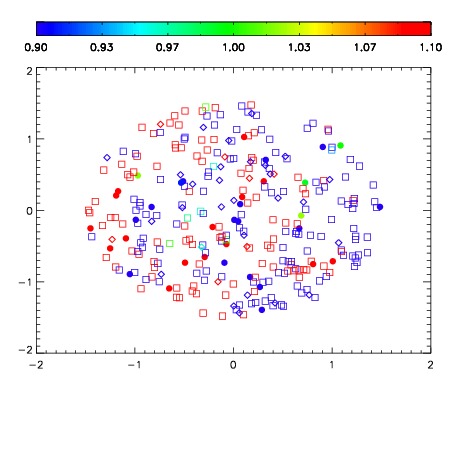
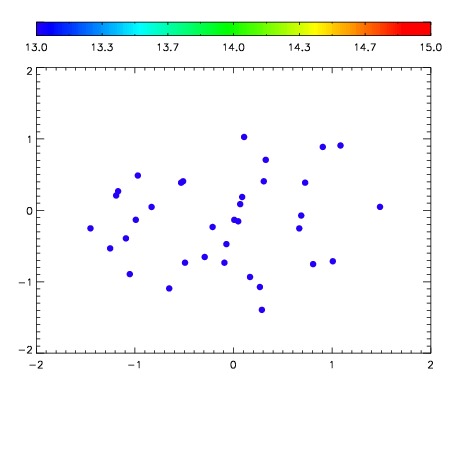

| Frame | Nreads | Zeropoints | Mag plots | Spatial mag deviation | Spatial sky 16325A emission deviations (filled: sky, open: star) | Spatial sky continuum emission | Spatial sky telluric CO2 absorption deviations (filled: H < 10) | |||||||||||||||||||||||
| 0 | 0 |
|
|
|
|
|
|
| IPAIR | NAME | SHIFT | NEWSHIFT | S/N | NAME | SHIFT | NEWSHIFT | S/N |
| 0 | 10530050 | 0.510285 | 0.00000 | 69.1966 | 10530048 | 0.00337972 | 0.506905 | 52.5648 |
| 1 | 10530046 | 0.505021 | 0.00526404 | 177.600 | 10530045 | 0.00000 | 0.510285 | 164.012 |
| 2 | 10530047 | 0.506697 | 0.00358802 | 150.001 | 10530052 | 0.0280792 | 0.482206 | 152.884 |
| 3 | 10530051 | 0.510219 | 6.60419e-05 | 138.359 | 10530049 | 0.00373410 | 0.506551 | 121.974 |