| Red | Green | Blue | |
| z | 17.64 | ||
| znorm | Inf | ||
| sky | -Inf | -Inf | -Inf |
| S/N | 22.4 | 40.3 | 44.5 |
| S/N(c) | 0.0 | 0.0 | 0.0 |
| SN(E/C) |

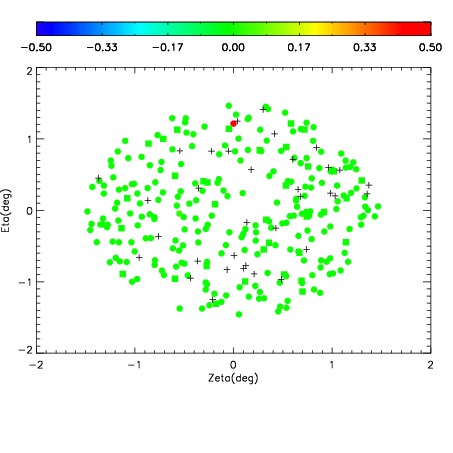
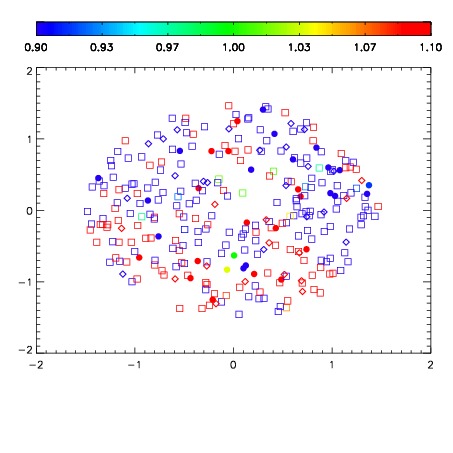
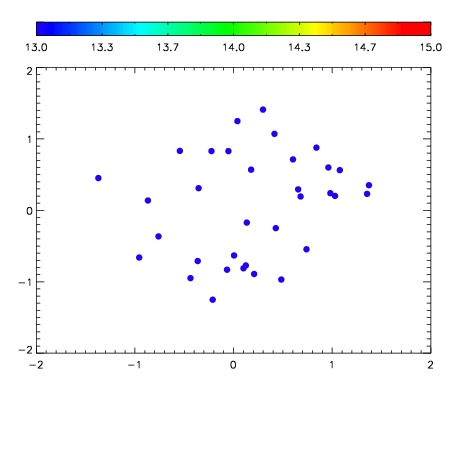

| Frame | Nreads | Zeropoints | Mag plots | Spatial mag deviation | Spatial sky 16325A emission deviations (filled: sky, open: star) | Spatial sky continuum emission | Spatial sky telluric CO2 absorption deviations (filled: H < 10) | |||||||||||||||||||||||
| 0 | 0 |
|
|
|
|
|
|
| IPAIR | NAME | SHIFT | NEWSHIFT | S/N | NAME | SHIFT | NEWSHIFT | S/N |
| 0 | 11360043 | 0.481450 | 0.00000 | 188.116 | 11360044 | -0.00225620 | 0.483706 | 169.006 |
| 1 | 11360038 | 0.478571 | 0.00287899 | 207.602 | 11360037 | 0.00000 | 0.481450 | 210.296 |
| 2 | 11360042 | 0.480639 | 0.000810981 | 203.492 | 11360040 | -0.00227917 | 0.483729 | 199.444 |
| 3 | 11360039 | 0.479163 | 0.00228700 | 194.619 | 11360041 | -0.00274185 | 0.484192 | 196.549 |